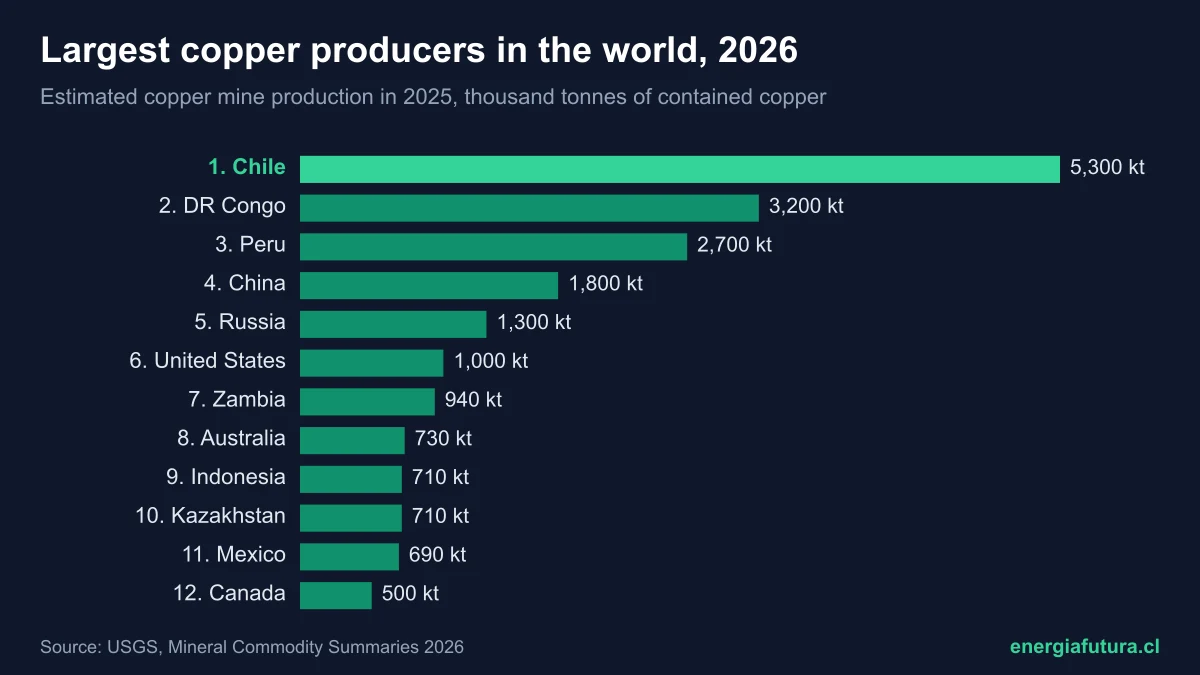
Updated on October 18, 2026. Chile is the world's largest copper producer, with estimated mine output of 5.3 million tonnes of contained copper in 2025, 23% of the world total, according to the US Geological Survey's Mineral Commodity Summaries 2026 (USGS). It is followed by the Democratic Republic of the Congo (3.2 million) and Peru (2.7 million). The world produced about 23 million tonnes.
Chile also has the largest copper reserves on the planet: 180 million tonnes, 18.4% of the total. But in refining, where concentrate is turned into pure copper cathodes, the undisputed leader is China, with almost half the world's refined copper. This is the full ranking.
Ranking of the world's largest copper producers
The table ranks countries by copper mine production in 2025, measured in thousand tonnes of contained copper. The 2025 figures are USGS estimates published in January 2026; the 2024 figures are revised data.
| # | Country | Mine production 2025e (thousand t) | Production 2024 (thousand t) | World share 2025 |
|---|---|---|---|---|
| 1 | Chile | 5,300 | 5,510 | 23.0% |
| 2 | DR Congo | 3,200 | 2,990 | 13.9% |
| 3 | Peru | 2,700 | 2,740 | 11.7% |
| 4 | China | 1,800 | 1,840 | 7.8% |
| 5 | Russia | 1,300 | 1,020 | 5.7% |
| 6 | United States | 1,000 | 1,050 | 4.3% |
| 7 | Zambia | 940 | 823 | 4.1% |
| 8 | Australia | 730 | 765 | 3.2% |
| 9 | Indonesia | 710 | 1,010 | 3.1% |
| 10 | Kazakhstan | 710 | 724 | 3.1% |
| 11 | Mexico | 690 | 717 | 3.0% |
| 12 | Canada | 500 | 515 | 2.2% |
| 13 | Poland | 410 | 400 | 1.8% |
| — | Other countries | 3,000 | 2,850 | 13.0% |
| — | World total | 23,000 | 23,000 | 100% |
The top three, Chile, Congo and Peru, produce almost half the world's mined copper (48.7%). Two of them are in South America: together with Mexico, Latin America supplies about 38% of world output.
Chile: the largest copper producer, but with falling output
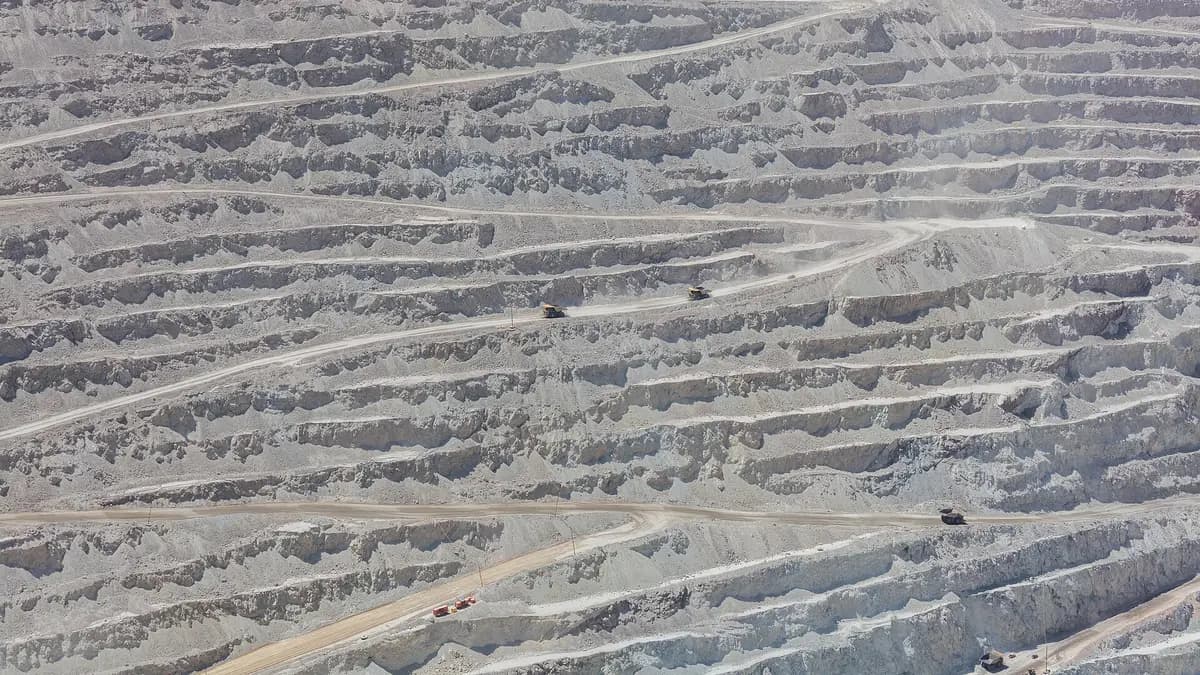
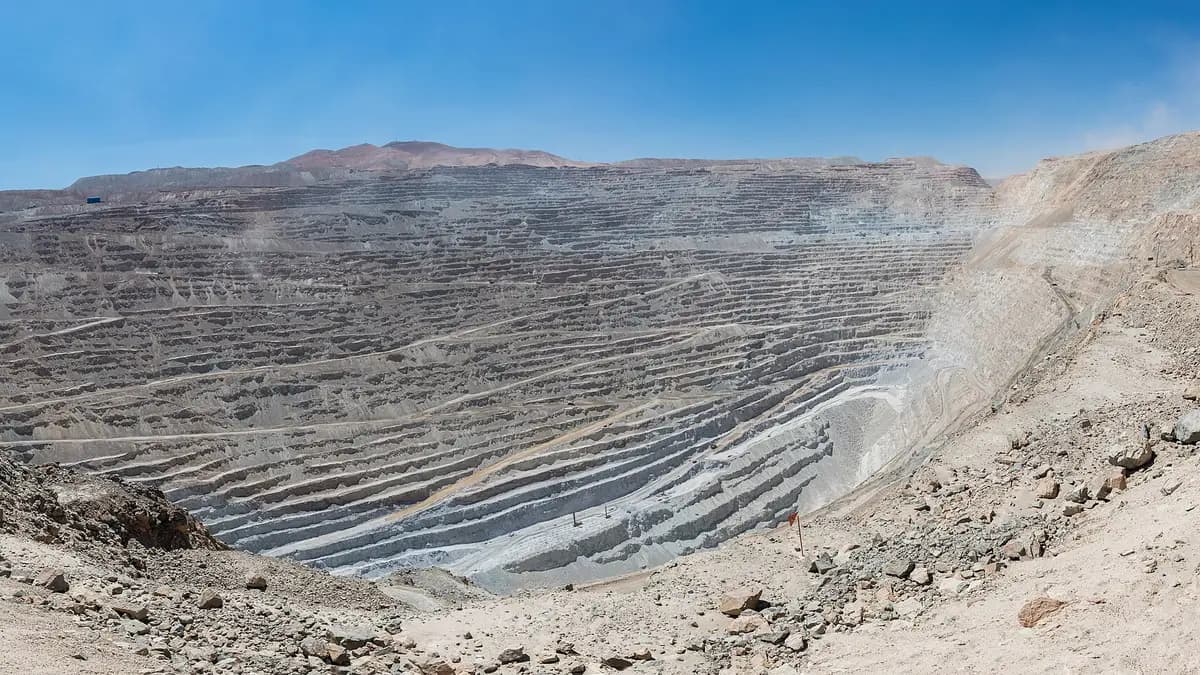
Chile leads comfortably, but its output is falling. According to the USGS, it went from 5.51 million tonnes in 2024 to 5.3 million in 2025, a drop of 3.8%. In August, the Chilean Copper Commission (Cochilco) projected 2026 output at 5.27 million (-2.6%) and a recovery to 5.55 million in 2027, according to Reporte Minero. Among the reasons the industry usually cites is lower ore grades at mature deposits such as Chuquicamata, which means moving more rock for each tonne of copper.
Congo grew the most: from 2.99 to 3.2 million tonnes. If it keeps that pace, it could narrow the gap with Chile in the coming years. Russia also grew strongly (+27%), while Indonesia fell about 30%, from 1.01 to 0.71 million tonnes, according to the USGS.
How copper production changed between 2024 and 2025
| Country | 2024 (thousand t) | 2025e (thousand t) | Change |
|---|---|---|---|
| Chile | 5,510 | 5,300 | -3.8% |
| DR Congo | 2,990 | 3,200 | +7.0% |
| Peru | 2,740 | 2,700 | -1.5% |
| China | 1,840 | 1,800 | -2.2% |
| Russia | 1,020 | 1,300 | +27.5% |
| United States | 1,050 | 1,000 | -4.8% |
| Zambia | 823 | 940 | +14.2% |
| Indonesia | 1,010 | 710 | -29.7% |
| World | 23,000 | 23,000 | 0% |
World output stalled at 23 million tonnes while demand for copper for electrification keeps rising. That gap is one reason for the higher price: in August Cochilco projected an average of US$5.95 per pound in 2026, and in October the price was above US$6.6. In the United States, the USGS reported that the Comex price would average a record US$4.80 per pound in 2025, 14% more than in 2024.
Who refines the world's copper
Mining ore and refining it are two different businesses. Chile exports much of its copper as concentrate, which is smelted and refined in other countries. So for refined copper the ranking changes completely:
| # | Country | Refined copper 2025e (thousand t) | World share |
|---|---|---|---|
| 1 | China | 14,000 | 48.3% |
| 2 | DR Congo | 2,800 | 9.7% |
| 3 | Chile | 1,700 | 5.9% |
| 4 | Japan | 1,400 | 4.8% |
| 5 | Russia | 950 | 3.3% |
| 6 | United States | 850 | 2.9% |
| 7 | India | 620 | 2.1% |
| 8 | Germany | 610 | 2.1% |
| 9 | South Korea | 610 | 2.1% |
| 10 | Poland | 560 | 1.9% |
| — | World total | 29,000 | 100% |
China refines 14 million tonnes, almost half the world total, even though its mine output is only 1.8 million: it imports concentrate from Chile, Peru and other countries. Chilean refining fell from 1.94 to 1.7 million tonnes between 2024 and 2025. Total refined output (29 million) exceeds mine output (23 million) because it includes copper recovered from scrap.
Copper reserves by country: Chile leads here too
Reserves are the copper that can be extracted economically with current technology. Chile has the world's largest, with Australia, Peru, Congo and Russia completing the leading group:
| # | Country | Reserves (million t of copper) | Share |
|---|---|---|---|
| 1 | Chile | 180 | 18.4% |
| 2 | Australia | 100* | 10.2% |
| 3 | Peru | 85 | 8.7% |
| 4 | DR Congo | 80 | 8.2% |
| 5 | Russia | 80 | 8.2% |
| 6 | Mexico | 53 | 5.4% |
| 7 | United States | 47 | 4.8% |
| 8 | China | 41 | 4.2% |
| 9 | Poland | 33 | 3.4% |
| 10 | Indonesia and Zambia | 21 each | 2.1% each |
| — | World total | 980 | 100% |
(*) The USGS notes that, for Australia, JORC-compliant reserves are 27 million tonnes. At current rates, Chile's reserves would last about 34 years of production, a simple Energía Futura calculation that does not account for new discoveries or price changes.
Why copper is key to the energy transition
Copper is the metal of electrification. Electric cars, wind and solar farms, transmission grids and batteries use much more copper than their fossil equivalents. In the United States, according to the USGS, 23% of copper goes into electrical and electronic products, and in November 2025 the country added copper to its official list of critical minerals.
That demand, combined with supply that is not growing, supports prices. On October 16, 2026 a tonne reached US$14,595 in London, 40% more than a year earlier, as we reported in the copper price in London.
Chile holds a similar position in lithium: it has the world's largest reserves, 25% of the total, as we show in the world ranking of lithium reserves. And exports of that mineral nearly tripled this year, according to lithium export figures through September.
Methodology and source
The data come from the copper chapter of the USGS Mineral Commodity Summaries 2026, published in January 2026. Mine production is the recoverable copper contained in extracted ore; 2025 figures are estimates. Percentage shares and reserve life are Energía Futura calculations. Figures may differ from Cochilco's, which publishes monthly Chilean output based on company data.
It is worth distinguishing three measures. Mine production is the copper contained in ore leaving the mines, as concentrate or as leached cathodes. Refined production is the high-purity copper leaving refineries, including copper recovered from scrap. Reserves are the copper that can be extracted profitably with current technology and prices; resources, a broader concept, include deposits that would not be profitable today. According to the USGS, identified world resources total 1.5 billion tonnes of copper and undiscovered resources are estimated at 3.5 billion.
Does your company work in mining, metals or mining supply? Reach Energía Futura readers.
See advertising optionsFrequently asked questions
Which country is the world's largest copper producer?
Chile, with 5.3 million tonnes in 2025, 23% of world mine output, according to the USGS.
What are the three largest copper producers?
Chile (5.3 million tonnes), the Democratic Republic of the Congo (3.2 million) and Peru (2.7 million).
Which country has the most copper reserves?
Chile, with 180 million tonnes, 18.4% of world reserves. Australia comes next.
Which country refines the most copper?
China, with 14 million tonnes of refined copper in 2025, almost half the world total.
How often is this ranking updated?
The USGS publishes its figures every January. We will update this ranking on this same page with each new edition and with Cochilco's annual data.
How to cite this data
Energía Futura (2026). Largest copper producing countries in the world 2026. Based on USGS, Mineral Commodity Summaries 2026. Available at https://energiafutura.cl/en/news/largest-copper-producing-countries-2026-world-ranking-chile. The cover chart may be reproduced crediting Energía Futura and linking to this page.