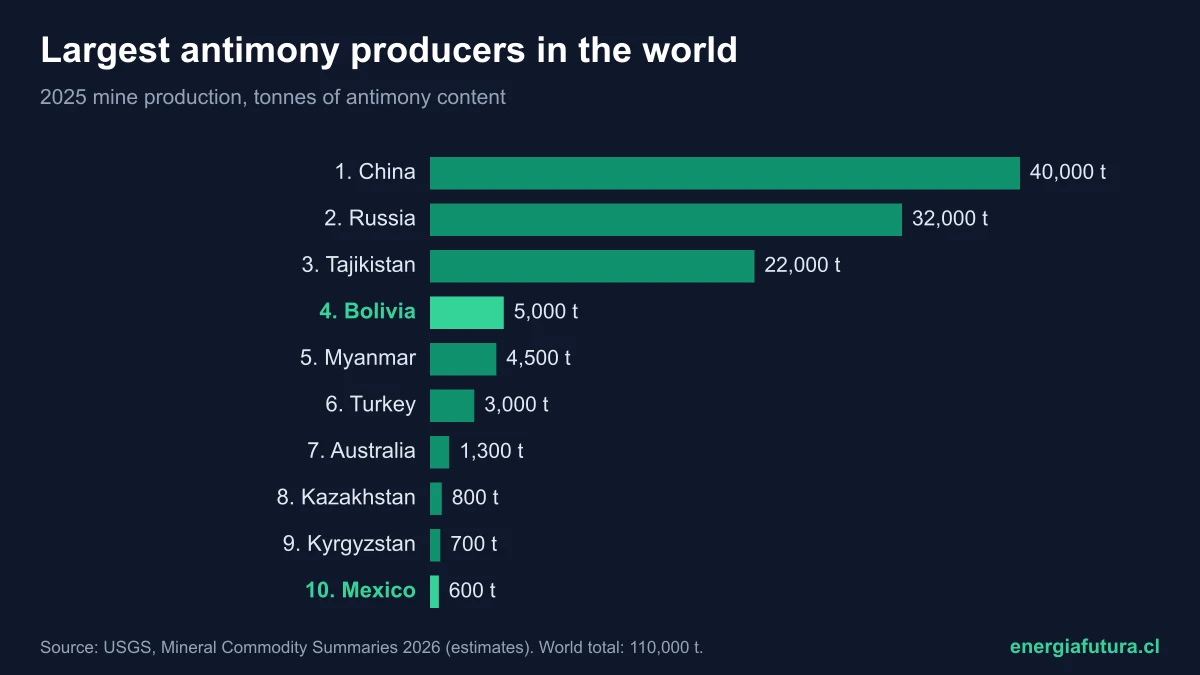
Updated on 10 November 2026. China is the world's largest antimony producer: in 2025 its mines produced about 40,000 tonnes of antimony content, 36.4% of the world total of 110,000 tonnes, according to the US Geological Survey (USGS) Mineral Commodity Summaries 2026. It is followed by Russia, with 32,000, and Tajikistan, with 22,000. Bolivia is fourth, with 5,000 tonnes, and is Latin America's largest producer.
Antimony is a little-known but strategic metal: it is used in flame retardants, in the lead alloys of lead-acid batteries, in ammunition and as a fining agent in solar panel glass. Its price soared after China, the largest producer, restricted exports in 2024. This profile gathers the ranking, the evolution since 2020, reserves, prices and uses, with USGS data.
View the data as a table
| World production | 110,000 t |
| China, the top producer | 36.4% |
| Bolivia, fourth in the world | 5,000 t |
| Average price 2025 | US$25 per pound |
Ranking of the largest antimony producers in 2025
The table ranks countries by their 2025 mine production, in tonnes of antimony content. The 2025 figures are USGS estimates published in February 2026; the United States started producing in 2025, but the USGS withholds its figure to avoid disclosing a single company's data.
| Rank | Country | 2024 (t) | 2025e (t) | Share of 2025 total |
|---|---|---|---|---|
| 1 | China | 40,000 | 40,000 | 36.4% |
| 2 | Russia | 40,000 | 32,000 | 29.1% |
| 3 | Tajikistan | 22,000 | 22,000 | 20.0% |
| 4 | Bolivia | 5,300 | 5,000 | 4.5% |
| 5 | Myanmar | 4,500 | 4,500 | 4.1% |
| 6 | Turkey | 3,000 | 3,000 | 2.7% |
| 7 | Australia | 1,270 | 1,300 | 1.2% |
| 8 | Kazakhstan | 800 | 800 | 0.7% |
| 9 | Kyrgyzstan | 700 | 700 | 0.6% |
| 10 | Mexico | 600 | 600 | 0.5% |
| 11 | Pakistan | 260 | 260 | 0.2% |
| 12 | Vietnam | 220 | 220 | 0.2% |
| 13 | Laos | 200 | 200 | 0.2% |
| 14 | Iran | 90 | 90 | 0.1% |
| 15 | Guatemala | 50 | 50 | 0.05% |
| — | World total | 119,000 | 110,000 | 100% |
Source: USGS, Mineral Commodity Summaries 2026. Percentages calculated by Energía Futura on the rounded total. Several 2024 and 2025 figures are estimates; the total excludes the United States. Chile produces no antimony: it does not appear in the USGS table.
View the data as a table
| People's Republic of China | 40,000 |
| Russia | 32,000 |
| Tajikistan | 22,000 |
| Bolivia | 5,000 |
| Myanmar | 4,500 |
| Türkiye | 3,000 |
| Australia | 1,300 |
| Kazakhstan | 800 |
| Kyrgyzstan | 700 |
| Mexico | 600 |
| Pakistan | 260 |
| Vietnam | 220 |
| Lao People's Democratic Republic | 200 |
| Iran | 90 |
| Guatemala | 50 |
Bolivia, Mexico and Guatemala: Latin America's antimony
Bolivia is the world's fourth-largest antimony producer, with 5,000 tonnes in 2025, and holds the third-largest reserves, with 310,000 tonnes. Its production nearly doubled from 2020, when it mined 2,600 tonnes. It was also the source of 6% of the antimony oxide imported by the United States between 2021 and 2024. Mexico produced 600 tonnes and Guatemala 50, bringing the region to about 5,650 tonnes, 5.1% of the total.
Mexico is also the main supplier of antimony ore and concentrate to the United States, with 86% of its imports of that product between 2021 and 2024, according to the USGS. Chile, by contrast, has no recorded antimony production; its weight in transition metals lies in copper, lithium, molybdenum and silver.
View the data as a table
| Bolivia | 5,000 |
| Mexico | 600 |
| Guatemala | 50 |
The largest antimony producers since 2020
World antimony production fell from 111,000 tonnes in 2020 to 83,100 in 2022 and then recovered to 119,000 in 2024. The figures for Russia and China have been heavily revised by the USGS, because much of the output is estimated from company and third-party reports; the series is best read as a trend rather than in detail.
| Year | China | Russia | Tajikistan | Bolivia | Myanmar | Turkey | Australia | World total |
|---|---|---|---|---|---|---|---|---|
| 2020 | 61,000 | 25,000 | 13,000 | 2,600 | 2,200 | 1,330 | 3,900 | 111,000 |
| 2021 | 61,000 | 20,000 | 16,800 | 2,600 | 4,600 | 1,300 | 4,000 | 112,000 |
| 2022 | 40,000 | 4,300 | 21,000 | 3,000 | 4,600 | 5,800 | 2,290 | 83,100 |
| 2023 | 62,300 | 13,000 | 17,000 | 3,700 | 4,500 | 1,600 | 1,860 | 106,000 |
| 2024 | 40,000 | 40,000 | 22,000 | 5,300 | 4,500 | 3,000 | 1,270 | 119,000 |
| 2025e | 40,000 | 32,000 | 22,000 | 5,000 | 4,500 | 3,000 | 1,300 | 110,000 |
Source: USGS, Mineral Commodity Summaries 2022 to 2026; the latest revised figure is used for each year. Tonnes of antimony content.
View the data as a table
| World | China | Russia | Tajikistan | Bolivia | |
|---|---|---|---|---|---|
| 2020 | 111,000 | 61,000 | 25,000 | 13,000 | 2,600 |
| 2021 | 112,000 | 61,000 | 20,000 | 16,800 | 2,600 |
| 2022 | 83,100 | 40,000 | 4,300 | 21,000 | 3,000 |
| 2023 | 106,000 | 62,300 | 13,000 | 17,000 | 3,700 |
| 2024 | 119,000 | 40,000 | 40,000 | 22,000 | 5,300 |
| 2025 | 110,000 | 40,000 | 32,000 | 22,000 | 5,000 |
View the data as a table
| 2020 | 2021 | 2022 | 2023 | 2024 | 2025 | |
|---|---|---|---|---|---|---|
| China | 61,000 | 61,000 | 40,000 | 62,300 | 40,000 | 40,000 |
| Russia | 25,000 | 20,000 | 4,300 | 13,000 | 40,000 | 32,000 |
| Tajikistan | 13,000 | 16,800 | 21,000 | 17,000 | 22,000 | 22,000 |
| Bolivia | 2,600 | 2,600 | 3,000 | 3,700 | 5,300 | 5,000 |
| Myanmar | 2,200 | 4,600 | 4,600 | 4,500 | 4,500 | 4,500 |
| Turkey | 1,330 | 1,300 | 5,800 | 1,600 | 3,000 | 3,000 |
| Australia | 3,900 | 4,000 | 2,290 | 1,860 | 1,270 | 1,300 |
| Mexico | 700 | 750 | 700 | 800 | 600 | 600 |
Sharp drops in the series, such as Russia's in 2022, largely reflect a lack of reliable information rather than real changes at the mines. In its 2026 edition, the USGS heavily revised the 2024 figures for China, Iran, Kazakhstan, Kyrgyzstan and Russia based on company, government and third-party reports.
Antimony reserves by country
World antimony reserves exceed 2 million tonnes, according to the USGS, about 18 times 2025 production. China leads with 830,000 tonnes, followed by Russia, with 350,000, and Bolivia, with 310,000.
| Country | Reserves (t) |
|---|---|
| China | 830,000 |
| Russia | 350,000 |
| Bolivia | 310,000 |
| Kyrgyzstan | 260,000 |
| Myanmar | 140,000 |
| Australia | 110,000 |
| Turkey | 99,000 |
| Canada | 78,000 |
| Tajikistan | 60,000 |
| United States | 60,000 |
| Vietnam | 54,000 |
| Pakistan | 26,000 |
| Mexico | 18,000 |
| World total | More than 2,000,000 |
Source: USGS, Mineral Commodity Summaries 2026. The US figure corresponds to the probable reserves of the Stibnite Gold project in Idaho. In Australia, JORC-compliant reserves are 11,000 tonnes.
Does your company work in mining, batteries or solar panel manufacturing? Reach Energía Futura's readers.
See advertising formatsAntimony price: from US$5 to US$25 per pound
The average antimony price was US$25 per pound in 2025, more than double that of 2024 (US$10.24) and almost five times that of 2021 (US$5.31), according to the USGS. The jump began when China announced export restrictions in August 2024 and then banned all exports to the United States in December that year: the monthly price went from US$9.80 per pound in August to US$18.10 in December 2024, rose another 52% to US$27.50 in June 2025 and fell to US$20.30 in November.
| Year | Average price (US$ per pound) |
|---|---|
| 2021 | 5.31 |
| 2022 | 6.18 |
| 2023 | 5.49 |
| 2024 | 10.24 |
| 2025e | 25 |
Source: USGS, Mineral Commodity Summaries 2026, with Argus Media prices for 99.65% antimony, delivered (CIF).
View the data as a table
| Antimony 99.65% | |
|---|---|
| 2021 | US$5.31 |
| 2022 | US$6.18 |
| 2023 | US$5.49 |
| 2024 | US$10.24 |
| 2025 | US$25.00 |
The price jump made projects that were previously unprofitable attractive, in the United States, Australia and Latin America.
Antimony in solar panels and batteries
In solar panel glass, antimony compounds such as sodium antimonate are used to remove bubbles and improve transparency. With the boom in panel manufacturing in China, that use grew strongly: Chinese producers interviewed by Asian Metal estimated photovoltaic demand at 80,000 to 100,000 tonnes of sodium antimonate in 2023 and 100,000 to 120,000 in 2024. Solar glass shares the panel's list of metals with silver, silicon and tin.
In lead-acid batteries, used in combustion cars and many backup systems, antimony hardens the lead plates. That is also the main source of recycling: in the United States, secondary antimony is recovered from the lead of used batteries and covered 12% of apparent consumption in 2025, according to the USGS. In that country, the main uses were metal products and flame retardants (49%), antimonial lead and ammunition (40%) and nonmetal products such as ceramics, glass and rubber (11%).
| Indicator (United States, 2025) | Data |
|---|---|
| Uses: metal products and flame retardants | 49% |
| Uses: antimonial lead and ammunition | 40% |
| Uses: ceramics, glass and rubber | 11% |
| Recycling as share of apparent consumption | 12% |
| Import reliance | 91% |
| Apparent consumption | 45,000 t |
Source: USGS, Mineral Commodity Summaries 2026.
Dependence explains the new projects outside China. In October 2025, a company began building an antimony mine in Idaho with conditional funding of US$80 million from the US Department of War, and in November another started mining at the Stibnite Hill mine in Montana, according to the USGS.
How to cite this data
Energía Futura (2026). "Largest antimony producers in the world 2026: country ranking, reserves and its role in solar panels". Updated on 10 November 2026. energiafutura.cl/en/news/largest-antimony-producers-in-the-world-2026-country-ranking-reserves-and-its-role-in-solar-panels. Data from USGS, Mineral Commodity Summaries 2026.
Frequently asked questions
Which country is the largest antimony producer?
China, with about 40,000 tonnes in 2025, 36.4% of the world total, according to the USGS.
Where does Bolivia rank in antimony production?
Fourth, with 5,000 tonnes in 2025, and it has the world's third-largest reserves.
How much antimony is produced in the world?
About 110,000 tonnes in 2025, versus 119,000 in 2024.
What is antimony used for?
In flame retardants, lead-acid batteries, ammunition, ceramics and as a fining agent in solar panel glass.
Why did the price of antimony rise?
Because China restricted exports in 2024 and banned sales to the United States; the average price went from US$10.24 per pound in 2024 to US$25 in 2025.
Does Chile produce antimony?
No. Chile does not appear in the USGS production table.