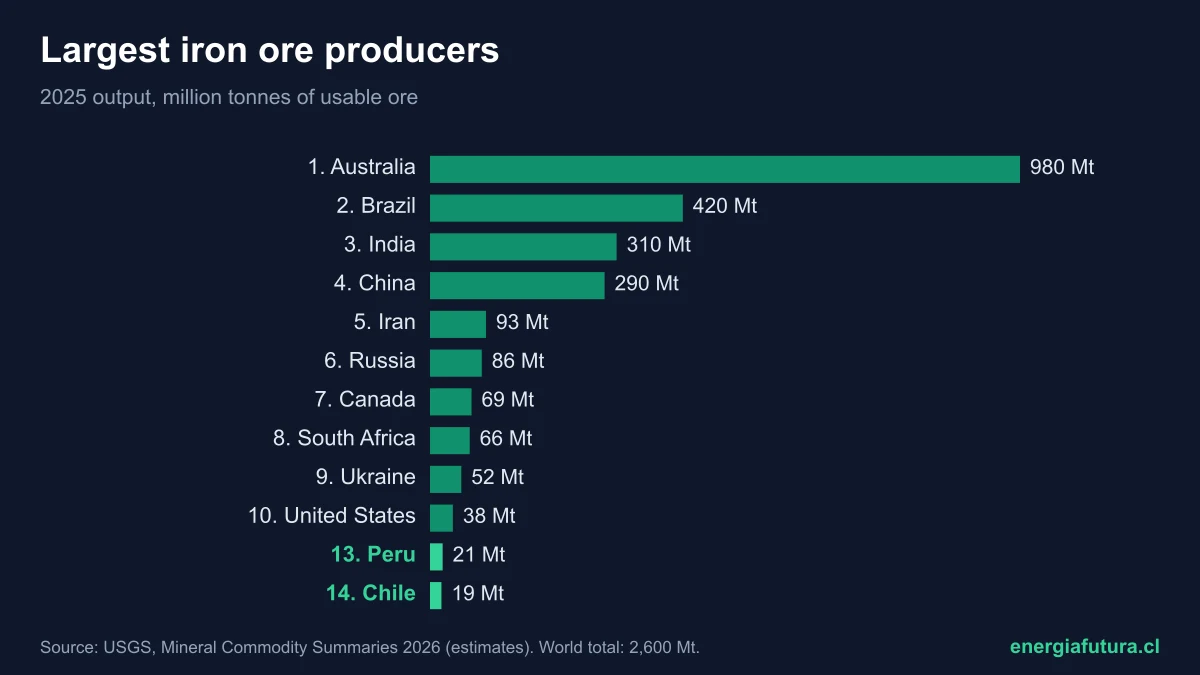
Updated on 10 November 2026. Australia is the world's largest iron ore producer: in 2025 its mines produced about 980 million tonnes of usable ore, 37.7% of the world total of 2.6 billion, according to the US Geological Survey (USGS) Mineral Commodity Summaries 2026. It is followed by Brazil, with 420 million, India, with 310 million, and China, with 290 million. Chile produced 19 million tonnes and ranks 14th.
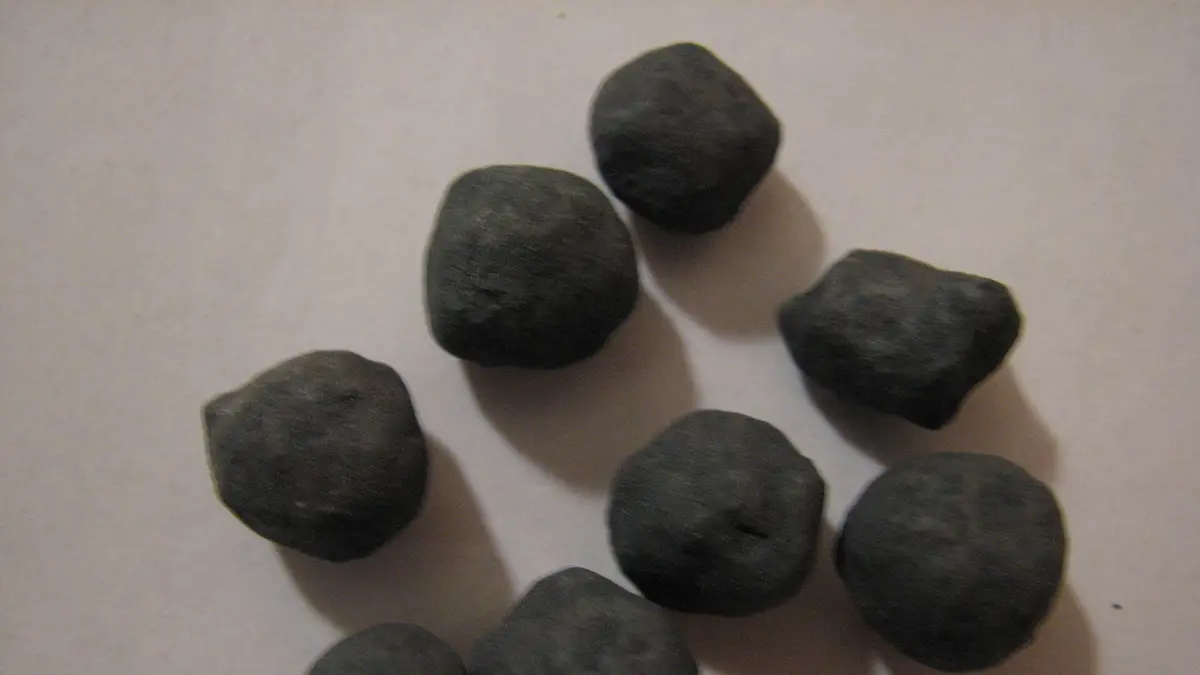
Iron ore is the raw material for steel, the metal of transmission towers, wind turbines, rails and cars. This profile gathers the 2025 ranking, iron content, the evolution since 2020, reserves by country, prices and the role of iron in green steel, with USGS data.
View the data as a table
| World production | 2,600 million t |
| Australia, the top producer | 37.7% |
| Chile's production | 19 million t |
| 62% fines price (Jan-Sep 2025) | US$99.07/t |
Ranking of the largest iron ore producers in 2025
The table ranks countries by their usable ore production in 2025, in million tonnes, and also shows iron content, which depends on the ore grade. The 2025 figures are USGS estimates published in February 2026.
| Rank | Country | Ore 2024 (Mt) | Ore 2025e (Mt) | Iron content 2025 (Mt) | Share of total |
|---|---|---|---|---|---|
| 1 | Australia | 982 | 980 | 600 | 37.7% |
| 2 | Brazil | 428 | 420 | 260 | 16.2% |
| 3 | India | 282 | 310 | 190 | 11.9% |
| 4 | China | 293 | 290 | 180 | 11.2% |
| 5 | Iran | 90 | 93 | 61 | 3.6% |
| 6 | Russia | 91 | 86 | 50 | 3.3% |
| 7 | Canada | 70 | 69 | 41 | 2.7% |
| 8 | South Africa | 64 | 66 | 42 | 2.5% |
| 9 | Ukraine | 54.7 | 52 | 32 | 2.0% |
| 10 | United States | 45.1 | 38 | 24 | 1.5% |
| 11 | Kazakhstan | 37 | 35 | 11 | 1.3% |
| 12 | Sweden | 25 | 26 | 18 | 1.0% |
| 13 | Peru | 19.8 | 21 | 14 | 0.8% |
| 14 | Chile | 18 | 19 | 12 | 0.7% |
| 15 | Turkey | 17 | 18 | 11 | 0.7% |
| 16 | Mauritania | 14.3 | 15 | 9.3 | 0.6% |
| 17 | Mexico | 7.8 | 7.7 | 4.8 | 0.3% |
| — | Other countries | 60.7 | 64 | 36 | 2.5% |
| — | World total | 2,600 | 2,600 | 1,600 | 100% |
Source: USGS, Mineral Commodity Summaries 2026. Mt = million tonnes. The USGS publishes production in thousand tonnes; it is shown here in millions. Percentages calculated by Energía Futura on the rounded total of 2.6 billion.
View the data as a table
| Australia | 980 |
| Brazil | 420 |
| India | 310 |
| People's Republic of China | 290 |
| Iran | 93 |
| Russia | 86 |
| Canada | 69 |
| South Africa | 66 |
| Ukraine | 52 |
| United States | 38 |
| Kazakhstan | 35 |
| Sweden | 26 |
| Peru | 21 |
| Chile | 19 |
| Türkiye | 18 |
| Mauritania | 15 |
| Mexico | 8 |
Chile, Brazil and Peru: iron ore in Latin America
Brazil is the world's second-largest producer, with 420 million tonnes in 2025, and its Carajás mine, in the state of Pará, is one of the largest on the planet. It was also the source of 58% of the ore imported by the United States between 2021 and 2024, according to the USGS. Peru produced 21 million and Chile 19 million, bringing Latin America to about 468 million tonnes, close to 18% of the world total.
Chilean production is concentrated in the Atacama and Coquimbo regions and grew from 15.6 million tonnes in 2020 to 19 million in 2025. Chile supplied 4% of US iron ore imports between 2021 and 2024. Its reserves are 3 billion tonnes of ore, with 740 million of iron content. In copper, by contrast, Chile tops the ranking: compare in our profile of the world's largest copper producers.
View the data as a table
| Brazil | 420 |
| Peru | 21 |
| Chile | 19 |
| Mexico | 8 |
The largest iron ore producers since 2020
World iron ore production has hovered between 2.5 and 2.7 billion tonnes a year since 2020. Australia stays above 900 million, Brazil fluctuates between 390 and 445 million, and India is growing fastest: it went from 204 million in 2020 to 310 million in 2025 and overtook China.
| Year | Australia | Brazil | India | China | Russia | Iran | Chile | World total |
|---|---|---|---|---|---|---|---|---|
| 2020 | 912 | 388 | 204 | 360 | 100 | 49.5 | 15.6 | 2,470 |
| 2021 | 912 | 431 | 273 | 394 | 96 | 72.9 | 17.7 | 2,680 |
| 2022 | 944 | 435 | 251 | 272 | 84.2 | 78.3 | 17.7 | 2,500 |
| 2023 | 953 | 445 | 278 | 278 | 90.9 | 85.4 | 18.1 | 2,530 |
| 2024 | 982 | 428 | 282 | 293 | 91 | 90 | 18 | 2,600 |
| 2025e | 980 | 420 | 310 | 290 | 86 | 93 | 19 | 2,600 |
Source: USGS, Mineral Commodity Summaries 2022 to 2026; the latest revised figure is used for each year. Million tonnes of usable ore. China's drop between 2021 and 2022 partly reflects a change in the USGS series, so those years are not fully comparable.
View the data as a table
| Australia | Brazil | India | China | Russia | Chile | |
|---|---|---|---|---|---|---|
| 2020 | 912 | 388 | 204 | 360 | 100 | 16 |
| 2021 | 912 | 431 | 273 | 394 | 96 | 18 |
| 2022 | 944 | 435 | 251 | 272 | 84 | 18 |
| 2023 | 953 | 445 | 278 | 278 | 91 | 18 |
| 2024 | 982 | 428 | 282 | 293 | 91 | 18 |
| 2025 | 980 | 420 | 310 | 290 | 86 | 19 |
View the data as a table
| 2020 | 2021 | 2022 | 2023 | 2024 | 2025 | |
|---|---|---|---|---|---|---|
| Australia | 912 | 912 | 944 | 953 | 982 | 980 |
| Brazil | 388 | 431 | 435 | 445 | 428 | 420 |
| India | 204 | 273 | 251 | 278 | 282 | 310 |
| China | 360 | 394 | 272 | 278 | 293 | 290 |
| Russia | 100 | 96 | 84 | 91 | 91 | 86 |
| Iran | 50 | 73 | 78 | 85 | 90 | 93 |
| Ukraine | 79 | 84 | 34 | 42 | 55 | 52 |
| South Africa | 56 | 73 | 64 | 63 | 64 | 66 |
| Canada | 60 | 58 | 69 | 59 | 70 | 69 |
| Chile | 16 | 18 | 18 | 18 | 18 | 19 |
India is the most striking case in the series: its production grew 52% between 2020 and 2025, driven by its own steel industry, one of the fastest-growing in the world. The World Steel Association estimated that global finished steel demand would remain stable in 2025, with declines in China offset by increases in economies such as India, Vietnam, Egypt and Saudi Arabia, according to the USGS.
Iron ore reserves by country
World reserves total about 200 billion tonnes of crude ore, with 87 billion of iron content, according to the USGS. Australia leads with 59 billion tonnes of ore (27 billion of iron), followed by Russia and Brazil. Identified world resources exceed 900 billion tonnes of ore.
| Country | Crude ore reserves (Mt) | Iron content (Mt) |
|---|---|---|
| Australia | 59,000 | 27,000 |
| Russia | 35,000 | 14,000 |
| Brazil | 34,000 | 15,000 |
| China | 17,000 | 3,000 |
| Mauritania | 10,000 | 4,400 |
| Ukraine | 6,500 | 2,300 |
| Canada | 6,000 | 2,300 |
| India | 5,500 | 3,400 |
| Iran | 4,200 | 1,500 |
| Kazakhstan | 3,800 | 1,500 |
| United States | 3,600 | 2,700 |
| Chile | 3,000 | 740 |
| Peru | 1,800 | 1,000 |
| Sweden | 1,300 | 600 |
| South Africa | 1,200 | 680 |
| Mexico | 940 | 520 |
| World total | 200,000 | 87,000 |
Source: USGS, Mineral Commodity Summaries 2026. In Australia, JORC-compliant reserves are 24 billion tonnes of ore and 10 billion of iron.
Australia and Brazil also lead in reserves, which secures their weight for decades. China, the fourth-largest producer, has reserves of just 3 billion tonnes of iron content and relies increasingly on imports to feed the world's largest steel industry.
Does your company work in mining, steel or energy infrastructure? Reach Energía Futura's readers.
See advertising formatsIron ore price
The benchmark price, for 62% iron fines delivered to the Chinese port of Tianjin, averaged US$99.07 per tonne in the first nine months of 2025, versus US$112.07 in the same period of 2024, according to the USGS. In the United States, the average unit value reported by mines fell from US$156.42 in 2022 to about US$89 in 2025.
| Year | Unit value at US mines (US$/t) |
|---|---|
| 2021 | 141.78 |
| 2022 | 156.42 |
| 2023 | 120.36 |
| 2024 | 100.10 |
| 2025e | 89 |
Source: USGS, Mineral Commodity Summaries 2026.
View the data as a table
| Unit value | |
|---|---|
| 2021 | US$141.78 |
| 2022 | US$156.42 |
| 2023 | US$120.36 |
| 2024 | US$100.10 |
| 2025 | US$89.00 |
Iron ore and green steel
Most steel is produced in blast furnaces that use metallurgical coal to turn ore into iron, a very emissions-intensive process. The alternatives are the electric arc furnace with scrap and direct reduced iron (DRI), which can use natural gas or green hydrogen instead of coal. For that reason, in 2025 the United States added metallurgical coal to its list of critical minerals, according to the USGS.
In Chile, the debate arrived with AZA's purchase of Huachipato to produce steel from scrap in electric furnaces, which emit far less than the blast furnace route, as we reported in our story on that deal. Steel also uses other metals in this series, such as manganese and nickel.
How to cite this data
Energía Futura (2026). "Largest iron ore producers in the world 2026: country ranking, reserves and Chile's place". Updated on 10 November 2026. energiafutura.cl/en/news/largest-iron-ore-producers-in-the-world-2026-country-ranking-reserves-and-chiles-place. Data from USGS, Mineral Commodity Summaries 2026.
Frequently asked questions
Which country is the largest iron ore producer?
Australia, with about 980 million tonnes in 2025, 37.7% of the world total, according to the USGS.
Where does Chile rank in iron production?
14th, with 19 million tonnes of ore in 2025 and 12 million of iron content.
How much iron ore is produced in the world?
About 2.6 billion tonnes of usable ore in 2025, with 1.6 billion tonnes of iron content.
Which country has the largest iron reserves?
Australia, with 59 billion tonnes of ore and 27 billion of iron content.
Which is Latin America's largest iron producer?
Brazil, second in the world with 420 million tonnes, followed by Peru and Chile.
How much is a tonne of iron ore worth?
62% fines averaged US$99.07 per tonne between January and September 2025 in China, according to the USGS.