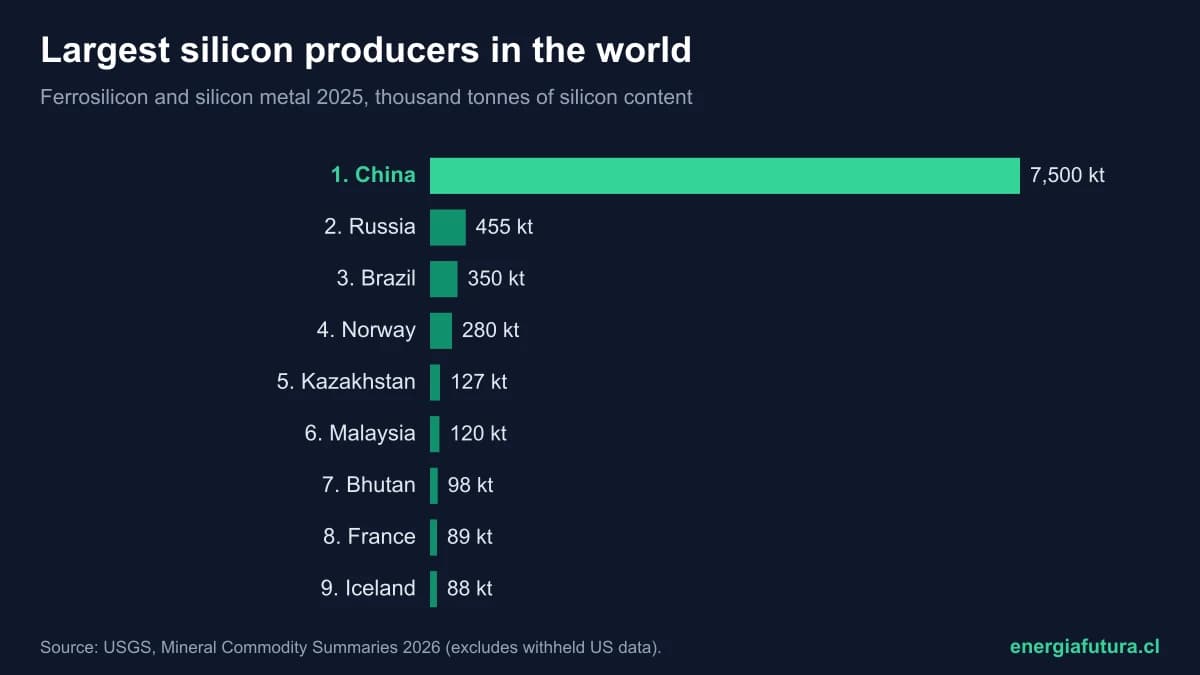
Updated on November 4, 2026. China is by far the world's largest silicon producer: in 2025 it produced about 7.5 million tonnes of contained silicon across ferrosilicon and silicon metal, around 78% of the world total of 9.6 million, according to the silicon summary of the US Geological Survey (USGS), Mineral Commodity Summaries 2026, published in February. Russia is second with 455,000 tonnes and Brazil third with 350,000. The United States produces silicon, but the USGS withholds its figure to avoid disclosing company data.
Silicon is the raw material for almost every solar panel in the world: silicon metal is purified into polysilicon, which becomes ingots, wafers and photovoltaic cells. It is also used in aluminium alloys, silicones, chips and, as ferrosilicon, in steelmaking. This data sheet brings together the production ranking by country, the split between ferrosilicon and silicon metal, the price trend and what it means for solar energy.
Ranking of the largest silicon producers in the world in 2025
The USGS reports production in thousand tonnes of contained silicon, split into two products: ferrosilicon, an iron-silicon alloy used by the steel industry, and metallurgical-grade silicon metal, the basis of the solar and chemical value chains. The table adds both to rank countries.
| Rank | Country | Ferrosilicon 2025 (kt) | Silicon metal 2025 (kt) | Total 2025 (kt) | Share of total |
|---|---|---|---|---|---|
| 1 | China | 3,500 | 4,000 | 7,500 | 78.1% |
| 2 | Russia | 420 | 35 | 455 | 4.7% |
| 3 | Brazil | 170 | 180 | 350 | 3.6% |
| 4 | Norway | 150 | 130 | 280 | 2.9% |
| 5 | Kazakhstan | 120 | 7 | 127 | 1.3% |
| 6 | Malaysia | 120 | — | 120 | 1.3% |
| 7 | Bhutan | 98 | — | 98 | 1.0% |
| 8 | France | 21 | 68 | 89 | 0.9% |
| 9 | Iceland | 72 | 16 | 88 | 0.9% |
| 10 | India | 59 | — | 59 | 0.6% |
| 11 | Canada | 23 | 34 | 57 | 0.6% |
| 12 | Australia | — | 47 | 47 | 0.5% |
| — | World total (excl. US) | 5,000 | 4,600 | 9,600 | 100% |
Source: USGS, Mineral Commodity Summaries 2026. 2025 figures are estimates. The world total excludes the United States, whose production the USGS does not publish. Spain (44 kt) and South Africa (45 kt) complete the list with smaller figures; other countries add up to 86 kt. Chile is not among the producers.
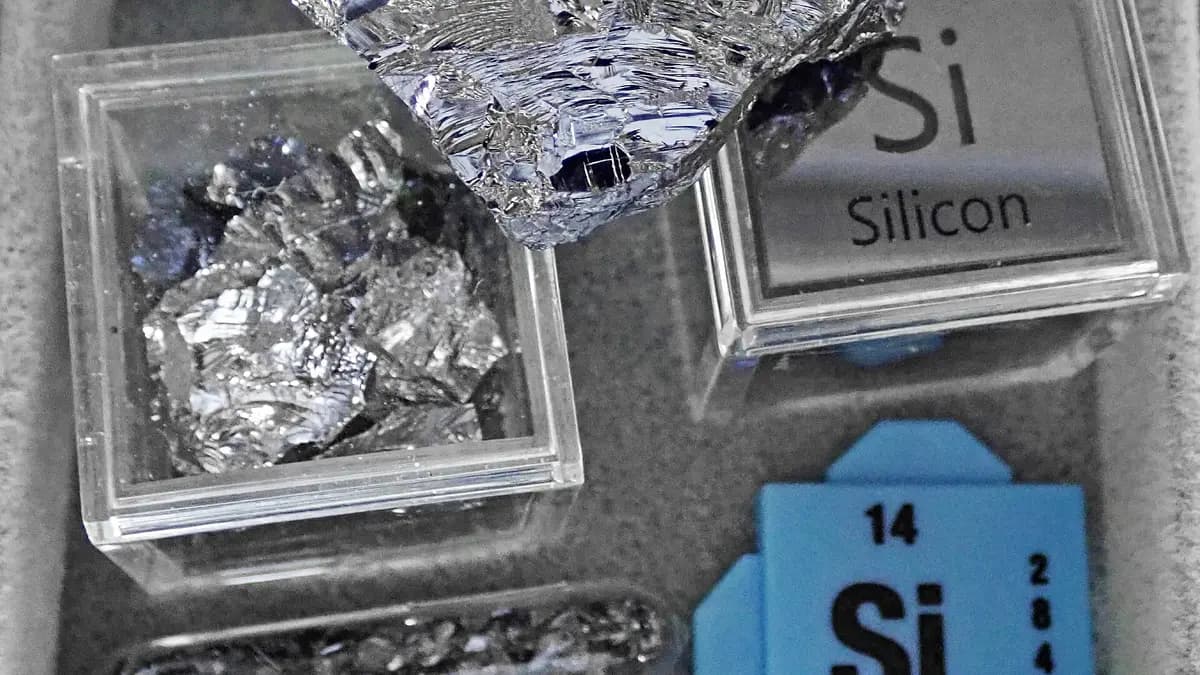
China, the world's largest silicon producer
China's lead is biggest in silicon metal, the product that feeds the solar industry: it produced 4.0 million tonnes of the world's 4.6 million in 2025, or 87%. Far behind come Brazil (180,000 t), Norway (130,000 t) and France (68,000 t). In ferrosilicon, China produced 3.5 million of 5.0 million (70%), with Russia second (420,000 t).
Making silicon metal takes a lot of electricity: it is produced by reducing quartz with carbon in electric arc furnaces. That is why the big producers outside China, such as Norway and Iceland, have cheap hydropower, and why Chinese production is concentrated in provinces with abundant energy such as Xinjiang, Yunnan and Sichuan.
Silicon and solar panels
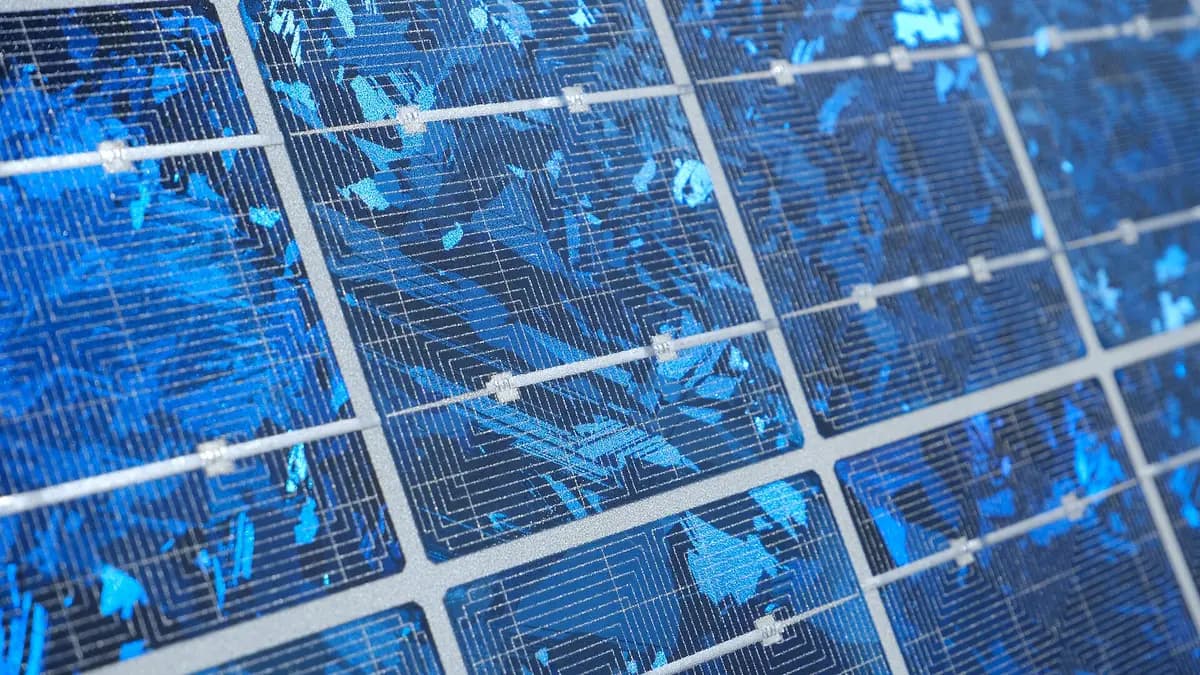
Nearly all panels installed today use crystalline silicon cells. The path is long: metallurgical-grade silicon metal (about 99% pure) is refined into solar-grade polysilicon, 99.9999% pure or more; it is then melted into ingots, sliced into wafers a few tenths of a millimetre thick and turned into cells that are assembled into modules.
China dominates every one of those stages. The International Energy Agency (IEA) estimated in its report on solar supply chains that the country holds more than 80% of manufacturing capacity in all stages of panel production, from polysilicon to modules. The USGS figures show that the lead starts earlier: with the raw material.
| Stage of the solar chain | What it is | Where it is concentrated |
|---|---|---|
| Quartz | Silica mineral, very abundant | Many countries |
| Silicon metal | ~99% pure, made in electric furnaces | China, 87% (USGS 2025) |
| Polysilicon | 99.9999% or more, solar grade | China, over 80% (IEA) |
| Ingots and wafers | Silicon blocks and slices | China, over 80% (IEA) |
| Cells and modules | The product that gets installed | China, over 80% (IEA) |
Sources: USGS, Mineral Commodity Summaries 2026; IEA, Solar PV Global Supply Chains. For Chile, which produces no silicon, the consequence is direct: almost all panels installed in the country come from that chain. This has pushed prices down sharply and explains Chile's solar growth, which we review in the world ranking of countries by solar energy.
Silicon prices: from 2022 highs to 2025 lows
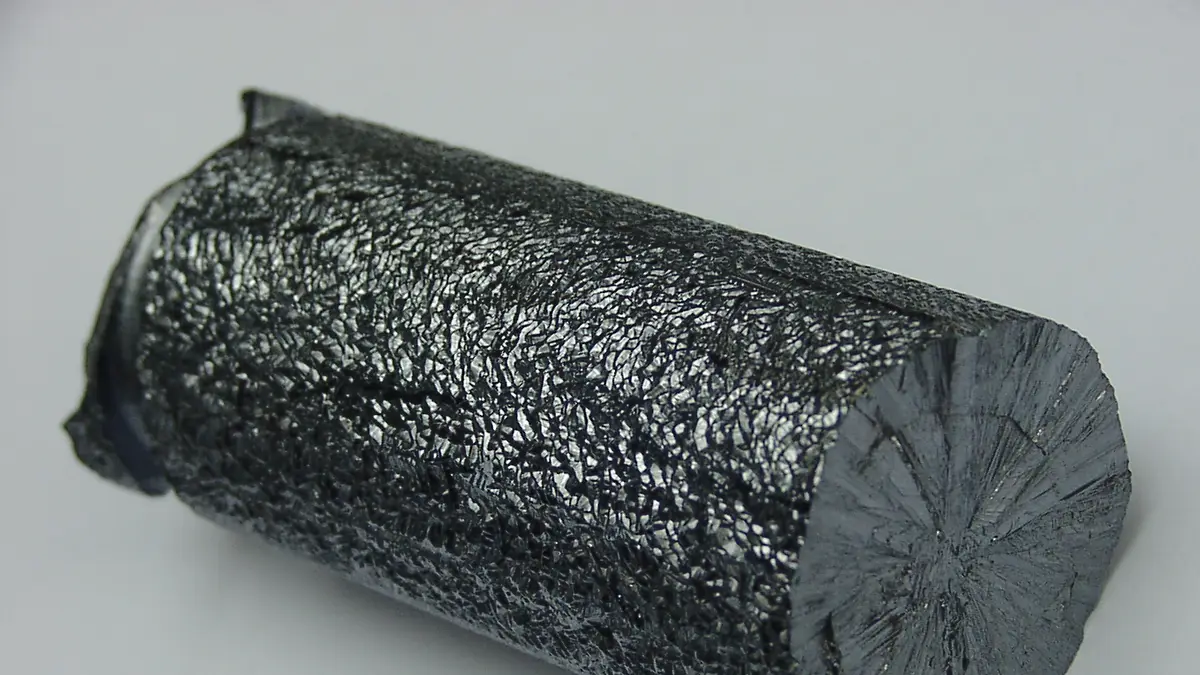
The US price of silicon metal reached 361.86 cents per pound in 2022 and fell to about 130 cents in 2025, a drop of 64%. The USGS attributes the 2025 decline to oversupply, weak demand from the aluminium and silicon industries and accumulated polysilicon stocks. In April 2025, Chinese silicon metal hit its lowest price since November 2016.
| Year | Silicon metal (US cents per pound) | Ferrosilicon 75% (US cents per pound) |
|---|---|---|
| 2021 | 220.31 | 192.28 |
| 2022 | 361.86 | 312.10 |
| 2023 | 179.69 | 142.23 |
| 2024 | 170.34 | 131.96 |
| 2025e | 130 | 140 |
Source: USGS, Mineral Commodity Summaries 2026, with S&P Global Platts prices. The 2025 figure is the January-October average. The fall in silicon goes hand in hand with the fall in panel prices, which helped installers but hurt manufacturers outside China.
Does your company sell, install or finance solar energy? Reach Energía Futura's readers.
See advertising optionsSilicon, a critical mineral
In November 2025, the United States added silicon to its final list of critical minerals, together with copper, lead, potash, rhenium and silver, according to the USGS. The reason is dependence: in 2025 its net import reliance for silicon metal exceeded 50% of apparent consumption, and its silicon metal imports rose by about 50% compared with 2024, partly due to tariff uncertainty.
Silicon is not scarce: quartz is abundant and the USGS considers resources sufficient to supply the world for many decades. What is critical is processing capacity, concentrated in a single country. The same pattern repeats in other inputs for the energy transition, such as graphite or rare earths, and differs from copper, where Chile is a leading player, as we show in the ranking of the largest copper producers.
Chile and the silicon in solar panels
Chile is not among silicon producers, but it is one of the most dynamic solar markets in Latin America. Every solar megawatt installed in the north uses thousands of panels made with silicon, mostly Chinese. That is why swings in silicon and polysilicon prices end up in the cost of Chilean projects and in the price of home panels, which we review in how much a home solar kit costs.
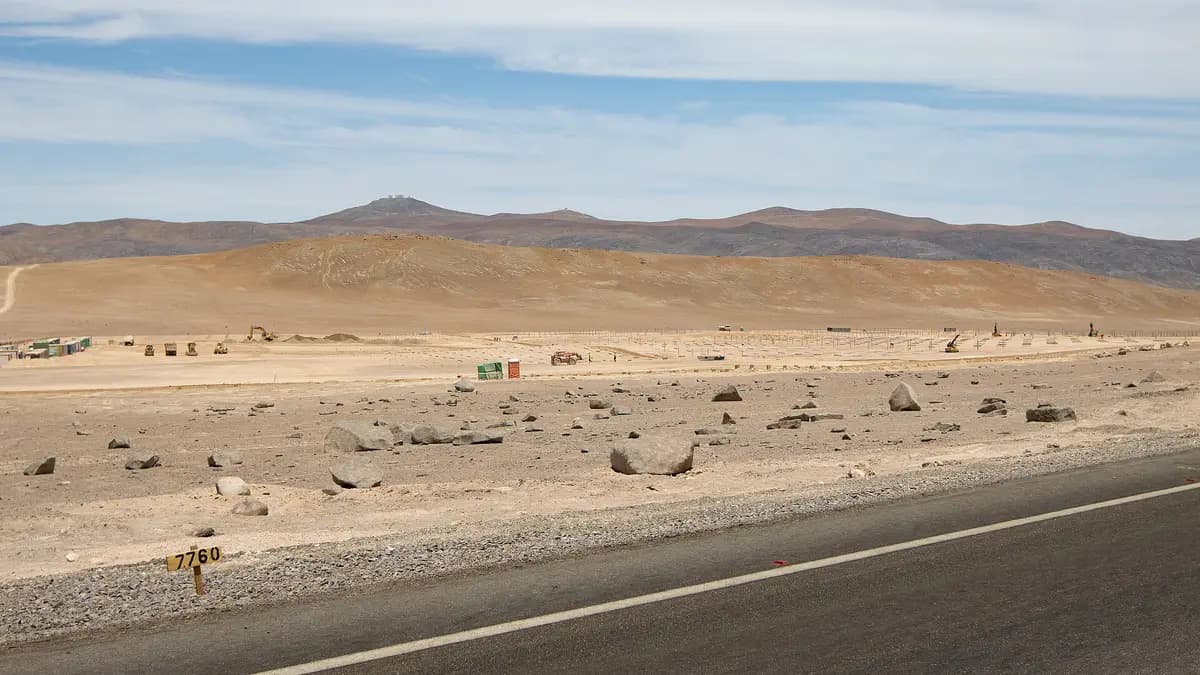
There has been occasional debate about whether the Atacama Desert, with its high irradiation and potential for cheap power, could attract electricity-intensive stages of the solar chain, such as silicon metal or polysilicon. For now there are no such plants in the country, and China's scale advantage is enormous: it produces almost four times as much silicon as the rest of the world combined.
How to cite this data
Energía Futura (2026). "Largest silicon producers in the world 2026: ranking by country and the metal behind solar panels". Updated on November 4, 2026. energiafutura.cl/en/news/largest-silicon-producers-in-the-world-2026-ranking-by-country-and-the-metal-behind-solar-panels. Data: USGS, Mineral Commodity Summaries 2026; International Energy Agency.
Frequently asked questions
Which country is the world's largest silicon producer?
China, with about 7.5 million tonnes of contained silicon in 2025, 78% of the world total, according to the USGS.
How much silicon does the world produce?
About 9.6 million tonnes of contained silicon in 2025 (5.0 million as ferrosilicon and 4.6 million as silicon metal), excluding the United States.
Does Chile produce silicon?
No. Chile does not appear among USGS producers; it imports the solar panels it uses.
What does silicon have to do with solar panels?
Almost all solar cells are made of crystalline silicon. Silicon metal is purified into polysilicon, which is sliced into wafers and turned into cells.
Why did silicon prices fall?
Because of oversupply, weak demand from aluminium and chemicals and polysilicon stocks, according to the USGS. Silicon metal fell from 361.86 to about 130 US cents per pound between 2022 and 2025.