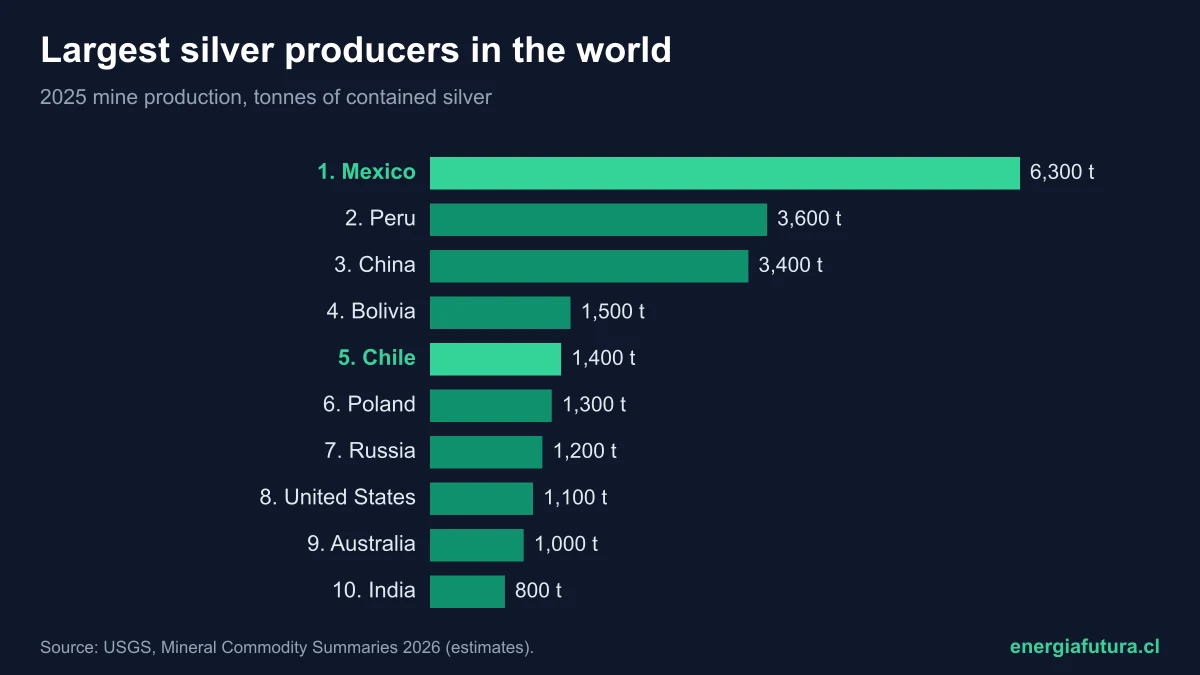
Updated on November 3, 2026. Mexico is the largest silver producer in the world, with estimated mine production of 6,300 tonnes in 2025, about 24% of the world total of 26,000 tonnes, according to the U.S. Geological Survey (USGS) silver summary, Mineral Commodity Summaries 2026, published in February. Peru is second with 3,600 tonnes (13.8%) and China third with 3,400 (13.1%). Chile ranks fifth, with 1,400 tonnes (5.4%).
Silver is the best electrical conductor of all metals, which is why it is in almost every photovoltaic cell: silver pastes form the contacts that collect the current from each cell. The solar industry used 186.6 million ounces in 2025, roughly 5,800 tonnes, according to the Silver Institute's World Silver Survey 2026, equal to more than a fifth of all the silver mined that year. This data sheet brings together the production ranking, reserves by country, the weight of solar power in demand and Chile's position.
Ranking of the largest silver producers in the world in 2025
The table ranks countries by estimated 2025 mine production, in tonnes of contained silver. The 2025 figures are USGS estimates published in February 2026; the 2024 column shows who grew and who fell back.
| Rank | Country | 2024 production (t) | 2025e production (t) | Share of 2025 total |
|---|---|---|---|---|
| 1 | Mexico | 5,780 | 6,300 | 24.2% |
| 2 | Peru | 3,510 | 3,600 | 13.8% |
| 3 | China | 3,430 | 3,400 | 13.1% |
| 4 | Bolivia | 1,490 | 1,500 | 5.8% |
| 5 | Chile | 1,200 | 1,400 | 5.4% |
| 6 | Poland | 1,320 | 1,300 | 5.0% |
| 7 | Russia | 1,280 | 1,200 | 4.6% |
| 8 | United States | 1,050 | 1,100 | 4.2% |
| 9 | Australia | 1,050 | 1,000 | 3.8% |
| 10 | India | 700 | 800 | 3.1% |
| 10 | Argentina | 774 | 800 | 3.1% |
| 12 | Kazakhstan | 850 | 630 | 2.4% |
| 13 | Canada | 366 | 400 | 1.5% |
| 13 | Sweden | 432 | 400 | 1.5% |
| — | World total | 25,300 | 26,000 | 100% |
Source: USGS, Mineral Commodity Summaries 2026. The 2025 data are estimates and may be revised in the 2027 edition. World output rose from 25,300 to 26,000 tonnes, up 2.8%, driven mainly by Mexico (+9%) and Chile; Kazakhstan, by contrast, fell from 850 to 630 tonnes.
Mexico, the largest silver producer in the world
Mexico has topped the ranking for decades. Its 6,300 tonnes in 2025 are almost double Peru's, and its silver mining history goes back to colonial times, with districts such as Zacatecas, Guanajuato and Chihuahua. Unlike Chile, Mexico has mines where silver is the main product rather than a by-product, which makes it more sensitive to the metal's price.
The Silver Institute warns that Mexican supply is not guaranteed: its annual report noted lower output at key operations in Mexico in 2025, while Peru increased the silver it recovers as a by-product of its copper mines. For an energy outlet, what matters is that three countries, Mexico, Peru and China, account for more than half of the silver the solar industry uses.
Silver reserves by country
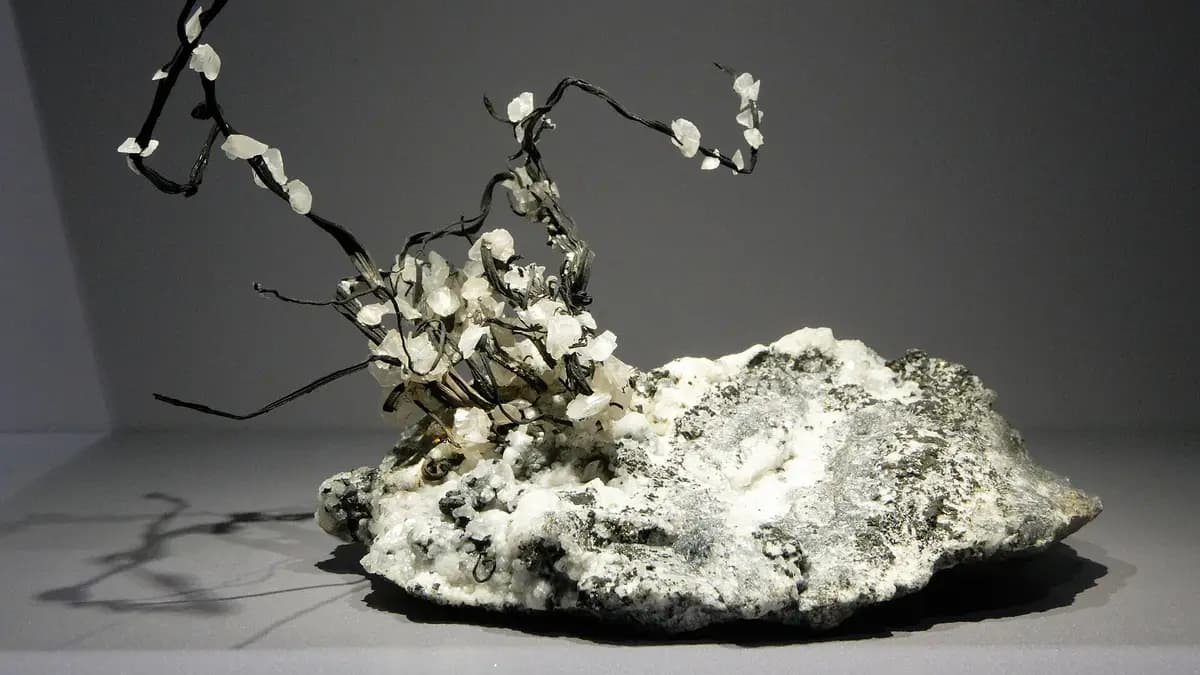
Reserves are the metal that can be extracted economically with current technology. The USGS puts world silver reserves at 610,000 tonnes, about 23 times 2025 production. Peru has the largest, with 110,000 tonnes, followed by Russia (92,000) and Australia (91,000). Chile is listed with 33,000 tonnes, a figure the USGS revised using government data.
| Country | Reserves (t) | Share of total |
|---|---|---|
| Peru | 110,000 | 18.0% |
| Russia | 92,000 | 15.1% |
| Australia | 91,000 | 14.9% |
| China | 67,000 | 11.0% |
| Poland | 59,000 | 9.7% |
| Mexico | 37,000 | 6.1% |
| Chile | 33,000 | 5.4% |
| United States | 23,000 | 3.8% |
| Bolivia | 22,000 | 3.6% |
| India | 8,000 | 1.3% |
| Argentina | 6,500 | 1.1% |
| Canada | 4,900 | 0.8% |
| World total | 610,000 | 100% |
Source: USGS, Mineral Commodity Summaries 2026. For Australia, JORC-compliant reserves are 22,000 tonnes; the 91,000 figure is the Australian government's broader estimate. No reserve figures are available for Kazakhstan and Sweden.
Chile's place among silver producers
Chile produced 1,327 tonnes of silver in 2025, 8% more than the 1,224 tonnes of 2024, according to Cochilco data reported by Redimin in February 2026. The USGS, which rounds and estimates, credits it with 1,400 tonnes and places it fifth in the world; using Cochilco's figures, Chile would sit between fifth and sixth, very close to Poland. In 2024, Cochilco's yearbook ranked it seventh, with 4.9% of the total.
What sets Chile apart is that its silver is almost always a by-product: in 2024, 80% of the country's silver came from copper mines and 20% from gold mines, while primary silver mining accounted for less than 1%. That is why Chilean output follows copper more than the silver price. Codelco, for instance, reported silver output of around 200 tonnes in 2025. Copper figures are in our ranking of the largest copper-producing countries.
| Chile indicator | Value | Source |
|---|---|---|
| 2025 production (Cochilco) | 1,327 t | Cochilco via Redimin |
| 2025 production (USGS estimate) | 1,400 t | USGS MCS 2026 |
| Change 2025 vs. 2024 | +8% | Cochilco |
| World rank 2025 (USGS) | 5th | USGS MCS 2026 |
| Reserves | 33,000 t | USGS MCS 2026 |
| Silver from copper mines (2024) | 80% | Cochilco via Redimin |
| Best year of the decade | 1,536 t (2015) | Cochilco via Redimin |
How much silver solar power uses
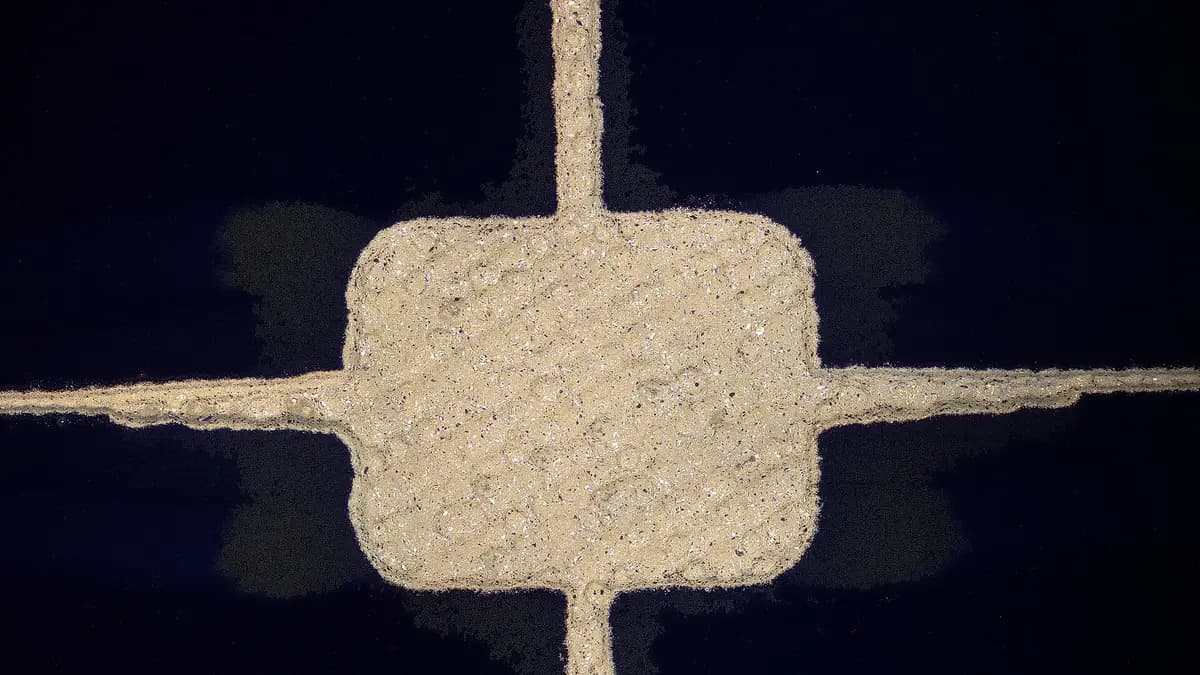
Silver demand for solar panels fell 6% in 2025 to 186.6 million ounces, from 197.5 million in 2024, and the Silver Institute expects a further 19% drop in 2026 to about 151 million ounces, the largest annual cut on record for the sector, according to pv magazine, which summarized the World Silver Survey 2026 released on April 15. The reason is not fewer panels but less silver per cell (so-called thrifting) and partial substitution with copper in the contacts, driven by higher prices.
Even so, the market remains in deficit: demand exceeded supply for the fifth year in a row in 2025, and the Silver Institute expects a 46.3 million ounce deficit in 2026. World mine supply rose 3% to 846.6 million ounces, according to the Silver Institute release. Chile, one of the most dynamic solar markets in the region, is part of that demand: data on its installed fleet are in solar energy in Chile in numbers.
| World market indicator | 2025 | Source |
|---|---|---|
| Mine production (USGS) | 26,000 t | USGS MCS 2026 |
| Mine supply (Silver Institute) | 846.6 Moz (+3%) | World Silver Survey 2026 |
| Estimated world consumption | 35,700 t | USGS MCS 2026 |
| Photovoltaic demand | 186.6 Moz (-6%) | World Silver Survey 2026 |
| Projected photovoltaic demand 2026 | ~151 Moz (-19%) | World Silver Survey 2026 |
| Projected 2026 deficit | 46.3 Moz | World Silver Survey 2026 |
| Average 2025 price | US$38 per ounce (+34%) | USGS MCS 2026 |
One troy ounce equals 31.1 grams, so 186.6 million ounces are about 5,800 tonnes: more than Mexico's entire output. In the United States, photovoltaics accounted for 15% of silver use in 2025, according to the USGS, which added silver to its critical minerals list in November 2025. The price averaged US$38 per ounce in 2025, 34% more than in 2024, and peaked at US$53.60 on November 13, 2025.
Why the ranking of silver producers matters
Solar demand will not exhaust silver in the short term, but it does affect module costs: when the metal rises, manufacturers speed up the switch to copper, which changes cell design. For countries like Chile, which produce silver as a by-product of copper, a higher price is extra revenue without opening new mines. The largest solar parks that use those panels are in our ranking of the largest solar power plant in the world.
There is also a recycling angle: in the United States about 1,000 tonnes of silver were recovered from scrap in 2025, 11% of apparent consumption. Panels reaching the end of their life contain small amounts of silver per module, but significant amounts across millions of panels, which is why silver recovery is one of the economic incentives for photovoltaic recycling.
Methodology
The ranking uses 2025 estimated mine production of contained silver from the USGS Mineral Commodity Summaries 2026 (February 2026), the most widely cited international source for comparing countries. For Chile, Cochilco's 2025 data are added; they differ from the USGS estimate because of rounding and the timing of each figure. Solar demand data come from the World Silver Survey 2026, prepared by Metals Focus for the Silver Institute. Ounces are converted to tonnes using the USGS factor (1 tonne = 32,150.7 troy ounces). This ranking will be updated at the same URL when the USGS publishes its 2027 edition.
How to cite this data
Energía Futura (2026). "Largest silver producers in the world 2026: ranking by country, reserves and Chile's place". Updated on November 3, 2026. energiafutura.cl/en/news/largest-silver-producers-in-the-world-2026-ranking-by-country-reserves-and-chile. Data: USGS, Mineral Commodity Summaries 2026; Silver Institute, World Silver Survey 2026; Cochilco.
Does your company work in mining, metals or solar energy? Reach Energía Futura's readers.
See advertising optionsFrequently asked questions
Which country is the largest silver producer in the world?
Mexico, with about 6,300 tonnes in 2025, 24% of the world total, according to the USGS. It is followed by Peru (3,600) and China (3,400).
Where does Chile rank in silver production?
Fifth according to the USGS estimate for 2025, with 1,400 tonnes. Using Cochilco data (1,327 tonnes), Chile sits between fifth and sixth, very close to Poland.
Which country has the largest silver reserves?
Peru, with 110,000 tonnes, 18% of world reserves of 610,000 tonnes. Russia (92,000) and Australia (91,000) complete the top three.
How much silver do solar panels use?
The photovoltaic industry used 186.6 million ounces (about 5,800 tonnes) in 2025, according to the Silver Institute. It is expected to fall to about 151 million ounces in 2026 because each cell uses less silver.
Why does Chile produce silver without large silver mines?
Because silver comes mixed with copper and gold. In 2024, 80% of Chilean silver came from copper mines and is recovered when that metal is refined.