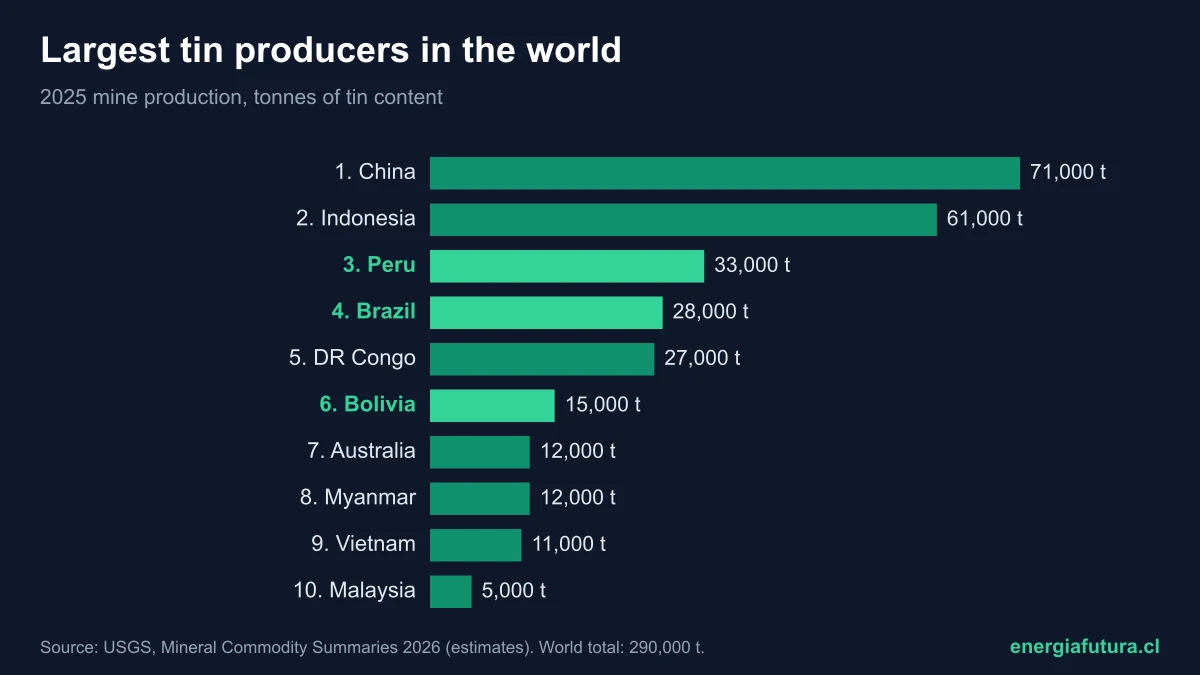
Updated on 9 November 2026. China is the world's largest tin producer: in 2025 its mines extracted about 71,000 tonnes of tin content, 24.5% of the world total of 290,000 tonnes, according to the US Geological Survey's Mineral Commodity Summaries 2026 (USGS). It is followed by Indonesia, with 61,000, and Peru, with 33,000. With Brazil in fourth place and Bolivia in sixth, Latin America supplies 76,000 tonnes, 26.2% of the planet's tin, more than China.
Tin is the metal of solder: it joins the components in every phone, computer and electric car, and the ribbons that connect the cells of a solar panel. This data sheet brings together the 2025 ranking, the trend since 2020, reserves by country, the metal's uses and its role in the energy transition, with data from the USGS and the International Tin Association (ITA).
View the data as a table
| World mine production 2025 | 290,000 t |
| China's share | 24.5% |
| Peru, Brazil and Bolivia's share | 26.2% |
| Share of tin used in solder | 51% |
Ranking of the largest tin producers in the world in 2025
The table ranks countries by their 2025 mine production, measured as tin content in concentrates, in tonnes. The 2025 figures are USGS estimates published in January 2026; the 2024 figures include major revisions for Brazil, Myanmar, Laos, Malaysia, Nigeria and Vietnam.
| Rank | Country | 2024 (t) | 2025e (t) | Share of 2025 total |
|---|---|---|---|---|
| 1 | China | 71,000 | 71,000 | 24.5% |
| 2 | Indonesia | 55,000 | 61,000 | 21.0% |
| 3 | Peru | 32,300 | 33,000 | 11.4% |
| 4 | Brazil | 27,600 | 28,000 | 9.7% |
| 5 | DR Congo | 26,000 | 27,000 | 9.3% |
| 6 | Bolivia | 21,200 | 15,000 | 5.2% |
| 7 | Australia | 11,300 | 12,000 | 4.1% |
| 8 | Myanmar | 20,000 | 12,000 | 4.1% |
| 9 | Vietnam | 11,000 | 11,000 | 3.8% |
| 10 | Malaysia | 5,460 | 5,000 | 1.7% |
| 11 | Rwanda | 4,100 | 4,600 | 1.6% |
| 12 | Russia | 3,260 | 4,500 | 1.6% |
| 13 | Nigeria | 3,100 | 3,500 | 1.2% |
| 14 | Laos | 1,860 | 1,800 | 0.6% |
| Other countries | 1,570 | 1,700 | 0.6% | |
| World total | 294,000 | 290,000 | 100% |
Source: USGS, Mineral Commodity Summaries 2026. Shares calculated by Energía Futura on the USGS rounded total. The 2024 figures for China, Indonesia, Congo, Myanmar, Vietnam, Rwanda and Nigeria are estimates. Chile produces no tin: it does not appear in the USGS table.
View the data as a table
| People's Republic of China | 71,000 |
| Indonesia | 61,000 |
| Peru | 33,000 |
| Brazil | 28,000 |
| DR Congo | 27,000 |
| Bolivia | 15,000 |
| Australia | 12,000 |
| Myanmar | 12,000 |
| Vietnam | 11,000 |
| Malaysia | 5,000 |
| Rwanda | 4,600 |
| Russia | 4,500 |
| Nigeria | 3,500 |
| Lao People's Democratic Republic | 1,800 |
Peru, Brazil and Bolivia: Latin America's tin producers
Peru is the world's third-largest tin producer, with 33,000 tonnes in 2025, and the fastest-growing in the region: in 2020 it mined 20,600. It is also the main supplier of refined tin to the United States: between 2021 and 2024 it provided 31% of US imports, according to the USGS.
Brazil almost doubled its output in five years, from 16,900 tonnes in 2020 to 28,000 in 2025, and ranks fourth. Bolivia, by contrast, fell from 21,200 to 15,000 tonnes between 2024 and 2025, 29% less, and dropped to sixth place. Even so, it is the second-largest supplier of refined tin to the United States, with 27% of its purchases.
View the data as a table
| Peru | 33,000 |
| Brazil | 28,000 |
| Bolivia | 15,000 |
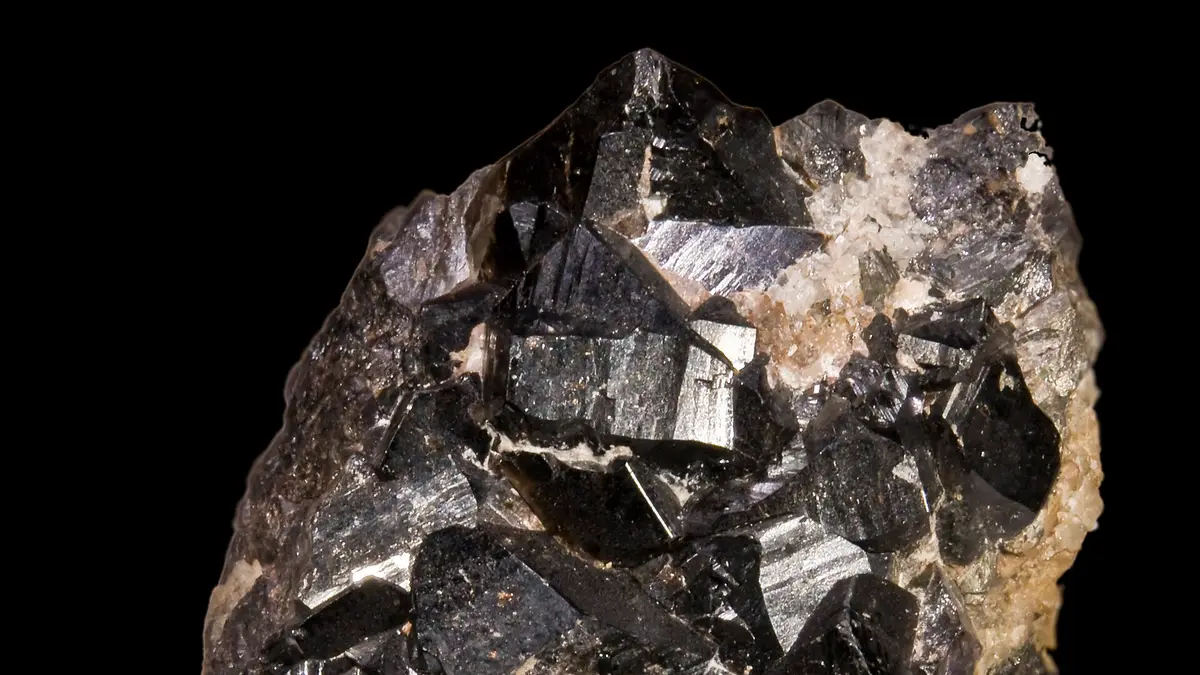
Tin is extracted from cassiterite, an oxide found in hard-rock veins, as in the Bolivian and Peruvian Andes, or in alluvial sand and gravel deposits, as in the Brazilian Amazon and the islands of Indonesia. Unlike copper, where Chile leads the world ranking, the country has no tin production: compare with our ranking of the largest copper producers in the world.
The largest tin producers since 2020
World tin production rose from 264,000 tonnes in 2020 to 307,000 in 2022 and then slipped back to 290,000 in 2025. Behind that curve are two stories: the fall of Myanmar and the ups and downs of Indonesia.
| Year | China | Indonesia | Myanmar | Peru | Brazil | Bolivia | World total |
|---|---|---|---|---|---|---|---|
| 2020 | 84,000 | 53,000 | 29,000 | 20,600 | 16,900 | 14,700 | 264,000 |
| 2021 | 90,000 | 70,000 | 36,900 | 26,995 | 15,517 | 19,628 | 305,000 |
| 2022 | 71,000 | 70,000 | 47,000 | 28,200 | 17,000 | 17,600 | 307,000 |
| 2023 | 70,000 | 69,000 | 34,000 | 26,200 | 29,300 | 18,700 | 305,000 |
| 2024 | 71,000 | 55,000 | 20,000 | 32,300 | 27,600 | 21,200 | 294,000 |
| 2025e | 71,000 | 61,000 | 12,000 | 33,000 | 28,000 | 15,000 | 290,000 |
Source: USGS, Mineral Commodity Summaries 2022 to 2026; for each year the most recent revised figure is used. Tonnes of tin content.
View the data as a table
| China | Indonesia | Myanmar | Peru | Brazil | Bolivia | |
|---|---|---|---|---|---|---|
| 2020 | 84,000 | 53,000 | 29,000 | 20,600 | 16,900 | 14,700 |
| 2021 | 90,000 | 70,000 | 36,900 | 26,995 | 15,517 | 19,628 |
| 2022 | 71,000 | 70,000 | 47,000 | 28,200 | 17,000 | 17,600 |
| 2023 | 70,000 | 69,000 | 34,000 | 26,200 | 29,300 | 18,700 |
| 2024 | 71,000 | 55,000 | 20,000 | 32,300 | 27,600 | 21,200 |
| 2025 | 71,000 | 61,000 | 12,000 | 33,000 | 28,000 | 15,000 |
View the data as a table
| 2020 | 2021 | 2022 | 2023 | 2024 | 2025 | |
|---|---|---|---|---|---|---|
| China | 84,000 | 90,000 | 71,000 | 70,000 | 71,000 | 71,000 |
| Indonesia | 53,000 | 70,000 | 70,000 | 69,000 | 55,000 | 61,000 |
| Peru | 20,600 | 26,995 | 28,200 | 26,200 | 32,300 | 33,000 |
| Brazil | 16,900 | 15,517 | 17,000 | 29,300 | 27,600 | 28,000 |
| DR Congo | 17,300 | 16,700 | 18,600 | 20,000 | 26,000 | 27,000 |
| Bolivia | 14,700 | 19,628 | 17,600 | 18,700 | 21,200 | 15,000 |
| Myanmar | 29,000 | 36,900 | 47,000 | 34,000 | 20,000 | 12,000 |
| Australia | 8,120 | 8,772 | 9,000 | 9,850 | 11,300 | 12,000 |
Myanmar became the world's third-largest producer, with 47,000 tonnes in 2022, and in 2025 managed only 12,000. Its tin comes mainly from the Wa region. In May 2024, ITA chairman Mariano Pero said at the association's annual conference that supply from that area remained cut off and that the price had again risen above US$35,000 per tonne.
Indonesia fell from 69,000 to 55,000 tonnes between 2023 and 2024 and recovered to 61,000 in 2025. With those changes, Peru rose to third place, with Brazil and Congo close behind. China, meanwhile, has held steady at around 71,000 tonnes since 2022.
View the data as a table
| World | China | Rest of the world | |
|---|---|---|---|
| 2020 | 264,000 | 84,000 | 180,000 |
| 2021 | 305,000 | 90,000 | 215,000 |
| 2022 | 307,000 | 71,000 | 236,000 |
| 2023 | 305,000 | 70,000 | 235,000 |
| 2024 | 294,000 | 71,000 | 223,000 |
| 2025 | 290,000 | 71,000 | 219,000 |
Tin reserves by country
World tin reserves exceed 6 million tonnes, according to the USGS, about 20 times 2025 production. Indonesia tops the list with 1.4 million, followed by China, with 1.2 million. Brazil and Myanmar hold 700,000 each and Bolivia 400,000. Peru, despite being the third-largest producer, has smaller reserves: 150,000 tonnes.
| Country | Reserves (t) | Share of total |
|---|---|---|
| Indonesia | 1,400,000 | 23.3% |
| China | 1,200,000 | 20.0% |
| Brazil | 700,000 | 11.7% |
| Myanmar | 700,000 | 11.7% |
| Australia | 570,000 | 9.5% |
| Russia | 460,000 | 7.7% |
| Bolivia | 400,000 | 6.7% |
| Peru | 150,000 | 2.5% |
| DR Congo | 91,000 | 1.5% |
| Vietnam | 23,000 | 0.4% |
| Other countries | 310,000 | 5.2% |
| World total | More than 6,000,000 |
Source: USGS, Mineral Commodity Summaries 2026. Shares calculated by Energía Futura on 6 million tonnes. In Australia, JORC-compliant reserves are 220,000 tonnes. Laos, Malaysia, Nigeria and Rwanda have no published reserve figure.
| China | 71,000 | 71,000 | 24.5 | 1,200,000 |
| Indonesia | 55,000 | 61,000 | 21.0 | 1,400,000 |
| Peru | 32,300 | 33,000 | 11.4 | 150,000 |
| Brazil | 27,600 | 28,000 | 9.7 | 700,000 |
| DR Congo | 26,000 | 27,000 | 9.3 | 91,000 |
| Bolivia | 21,200 | 15,000 | 5.2 | 400,000 |
| Australia | 11,300 | 12,000 | 4.1 | 570,000 |
| Myanmar | 20,000 | 12,000 | 4.1 | 700,000 |
| Vietnam | 11,000 | 11,000 | 3.8 | 23,000 |
| Malaysia | 5,460 | 5,000 | 1.7 | No data |
| Rwanda | 4,100 | 4,600 | 1.6 | No data |
| Russia | 3,260 | 4,500 | 1.6 | 460,000 |
| Nigeria | 3,100 | 3,500 | 1.2 | No data |
| Laos | 1,860 | 1,800 | 0.6 | No data |
Does your company work in mining, metals or solar panel manufacturing? Reach Energía Futura's readers.
See advertising optionsTin in solar panels and electronics
Solder is tin's main use: it accounted for 51% of world consumption in 2023, according to the ITA's annual survey of tin users, which estimated refined tin use at 357,100 tonnes that year, 3.9% less than in 2022. For 2024 it forecast a 3% rise to 367,900 tonnes. Consumption exceeds mine production because part of it is covered by recycling and stocks: the recycling input rate was 34.2% in 2023.
Within solder, solar ribbon (the tinned strips that connect the cells of a photovoltaic panel) already accounts for around 20% of production, according to the ITA, although its growth has slowed because of Chinese overcapacity and because manufacturers use less and less tin per panel. In 2024, the association's chairman said tin use in solar panels had tripled in five years to 35,000 tonnes and would exceed 40,000 tonnes by 2030.
View the data as a table
| Refined tin used in 2023 | 357,100 t |
| Solar ribbon within solder | 20% |
| Tin in solar panels | 35,000 t |
| 2023 recycling input rate | 34.2% |
A solar panel combines several metals from this series: the silver in the contacts, which we cover in the ranking of the largest silver producers in the world; the aluminium in the frames, in the ranking of the largest aluminium producers, and the tin in the joints. In electronics, the ITA estimates that 92% of solder was already lead-free in 2023.
Tin price, trade and recycling
The USGS estimated that the average tin price on the London Metal Exchange (LME) was 1,500 US cents per pound in 2025, 10% more than in 2024, equivalent to about US$33,000 per tonne. On the New York market, the average was 1,600 cents per pound, 13% more. Tin is one of the most expensive non-ferrous metals: it is worth several times as much as copper.
| Indicator | Figure | Source |
|---|---|---|
| LME price 2025 | 1,500 US cents per pound (+10%) | USGS |
| New York price 2025 | 1,600 US cents per pound (+13%) | USGS |
| World refined tin use 2023 | 357,100 t | ITA |
| Solder's share of use | 51% | ITA |
| Tin in solar panels | 35,000 t | ITA (2024) |
| World recycling input rate 2023 | 34.2% | ITA |
| Recycling in the United States 2025 | 17,000 t | USGS |
Tin recycles well. In the United States, which has had no tin mines or smelters since 1993 and 1989, about 17,000 tonnes were recovered from new and old scrap in 2025, according to the USGS. Old scrap covered 22% of the country's apparent consumption. As with zinc, recycling reduces the need for new mines.
How to cite this data
Energía Futura (2026). “Largest tin producers in the world 2026: country ranking, reserves and its role in solar panels”. Updated on 9 November 2026. energiafutura.cl/en/news/largest-tin-producers-in-the-world-2026-country-ranking-reserves-and-its-role-in-solar-panels. Data from USGS, Mineral Commodity Summaries 2026, and the International Tin Association (ITA).
Frequently asked questions
Which is the largest tin producer in the world?
China, with about 71,000 tonnes in 2025, 24.5% of the world total, according to the USGS.
Where does Peru rank in tin production?
Third, with 33,000 tonnes in 2025, 11.4% of the total. Brazil is fourth and Bolivia sixth.
How much tin is produced in the world?
About 290,000 tonnes of tin content in 2025, compared with 294,000 in 2024.
Which country has the largest tin reserves?
Indonesia, with 1.4 million tonnes, followed by China, with 1.2 million.
What is tin used for in solar panels?
For soldering the ribbons that connect the cells. The ITA estimates that solar panels use about 35,000 tonnes of tin a year.
Does Chile produce tin?
No. Chile does not appear in the USGS production table.