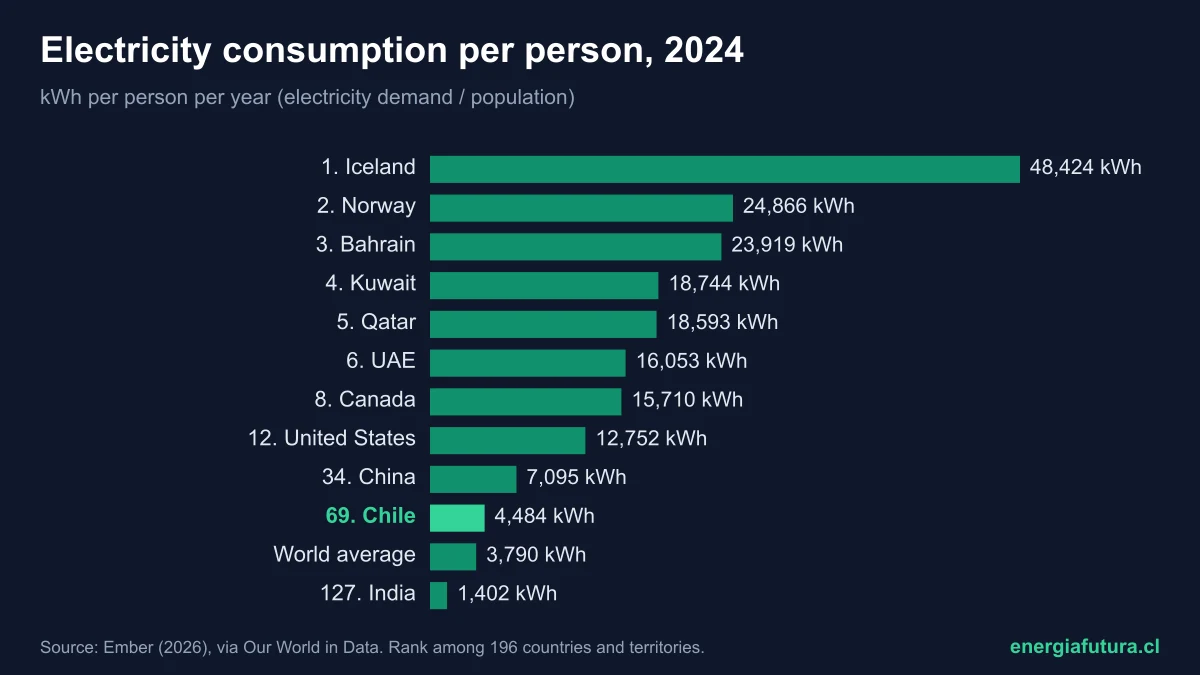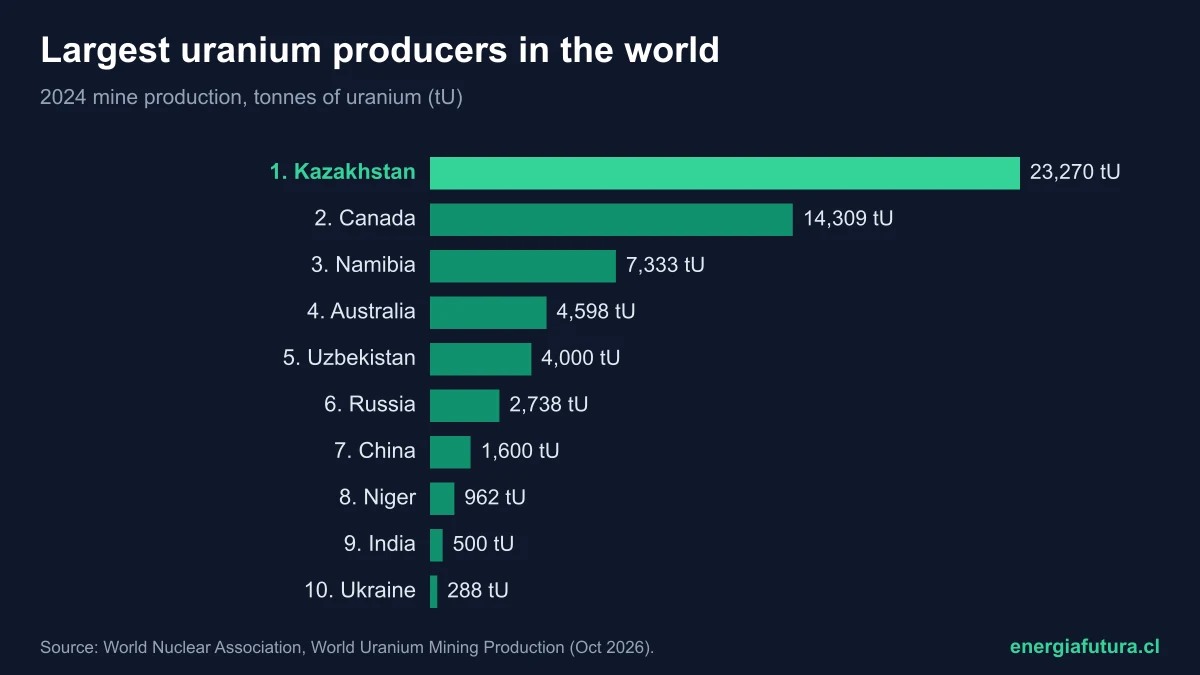
Updated on 5 November 2026. Kazakhstan is the world's largest uranium producer: in 2024 it mined 23,270 tonnes of uranium (tU), 38.6% of the world total of 60,213 tU, according to the World Nuclear Association (WNA), which updated its figures on 23 October 2026. Canada is second, with 14,309 tU (23.8%), and Namibia third, with 7,333 tU (12.2%). Together the three produce almost three out of every four tonnes on the planet.
Uranium is the fuel of nuclear power plants, which according to the WNA generate about 9% of the world's electricity, without emitting CO2 during operation. Mine production grew 10.6% in 2024 and covered 90% of what reactors need, about 69,000 tonnes a year according to the WNA; the rest comes from inventories and recycled material. This fact sheet brings together the country ranking, the largest mines and companies, resources and Latin America's place.
View the data as a table
| World production 2024 | 60,213 tU |
| Kazakhstan's share | 38.6% |
| Reactor demand covered by mines | 90% |
| Uranium reactors need per year | 69,000 tU |
Ranking of the largest uranium producers in the world in 2024
The table ranks countries by their mine production in 2024, in tonnes of contained uranium. The WNA marks the figures for Uzbekistan, China, India, South Africa and Ukraine as estimates.
| Rank | Country | Production 2023 (tU) | Production 2024 (tU) | Share of 2024 total |
|---|---|---|---|---|
| 1 | Kazakhstan | 21,109 | 23,270 | 38.6% |
| 2 | Canada | 11,001 | 14,309 | 23.8% |
| 3 | Namibia | 6,986 | 7,333 | 12.2% |
| 4 | Australia | 4,693 | 4,598 | 7.6% |
| 5 | Uzbekistan (est.) | 4,000 | 4,000 | 6.6% |
| 6 | Russia | 2,710 | 2,738 | 4.5% |
| 7 | China (est.) | 1,600 | 1,600 | 2.7% |
| 8 | Niger | 1,130 | 962 | 1.6% |
| 9 | India (est.) | 485 | 500 | 0.8% |
| 10 | Ukraine (est.) | 340 | 288 | 0.5% |
| 11 | United States | 19 | 260 | 0.4% |
| 12 | South Africa (est.) | 200 | 200 | 0.3% |
| Others | 161 | 155 | 0.3% | |
| World total | 54,433 | 60,213 | 100% |
Source: World Nuclear Association, World Uranium Mining Production, updated 23 October 2026. The WNA has not yet published 2025 figures. Percentages calculated by Energía Futura.
The industry measures uranium in two ways: tonnes of uranium (tU), as in this ranking, and tonnes of uranium oxide (U3O8), the form in which it is sold. The 60,213 tU of 2024 equal 71,006 tonnes of U3O8, according to the WNA. Prices are usually quoted in dollars per pound of U3O8, so it is worth checking which unit each source uses before comparing figures.
View the data as a table
| tU | |
|---|---|
| Kazakhstan | 23,270 tU |
| Canada | 14,309 tU |
| Namibia | 7,333 tU |
| Australia | 4,598 tU |
| Uzbekistan | 4,000 tU |
| Russia | 2,738 tU |
| People's Republic of China | 1,600 tU |
| Niger | 962 tU |
| India | 500 tU |
| Ukraine | 288 tU |
| United States | 260 tU |
| South Africa | 200 tU |
Kazakhstan, Canada and Namibia: the three big uranium producers
Kazakhstan has led world production since 2009, according to the WNA, thanks to in situ leaching (ISL): instead of digging, a solution is injected into the deposit and the dissolved uranium is pumped to the surface. State-owned Kazatomprom is the largest company in the sector, with 12,463 tU in 2024, 21% of the world. Five of the ten largest mines are in that country.
Canada made the biggest leap: it went from 3,885 tU in 2020, when it temporarily closed its mines because of low prices and the pandemic, to 14,309 in 2024, 30% more than in 2023. Its Saskatchewan mines have the highest uranium grades in the world: McArthur River/Key Lake produced 7,808 tU (13% of the world total) and Cigar Lake 6,501. Namibia grew with Husab and Rössing, two open-pit mines controlled by Chinese companies.
View the data as a table
| Kazakhstan | Canada | Namibia | Australia | Niger | |
|---|---|---|---|---|---|
| 2015 | 23,607 | 13,325 | 2,993 | 5,654 | 4,116 |
| 2016 | 24,689 | 14,039 | 3,654 | 6,315 | 3,479 |
| 2017 | 23,321 | 13,116 | 4,224 | 5,882 | 3,449 |
| 2018 | 21,705 | 7,001 | 5,525 | 6,517 | 2,911 |
| 2019 | 22,808 | 6,938 | 5,476 | 6,613 | 2,983 |
| 2020 | 19,477 | 3,885 | 5,413 | 6,203 | 2,991 |
| 2021 | 21,819 | 4,693 | 5,753 | 4,192 | 2,248 |
| 2022 | 21,227 | 7,351 | 5,611 | 4,553 | 2,020 |
| 2023 | 21,109 | 11,001 | 6,986 | 4,693 | 1,130 |
| 2024 | 23,270 | 14,309 | 7,333 | 4,598 | 962 |
The opposite case is Niger: it produced 4,116 tU in 2015 and 962 in 2024, a 77% drop, after mine closures and the political crisis that followed the 2023 coup. The United States, which produced less than 10 tonnes in 2020 and 2021, rebounded to 260 tU in 2024.
View the data as a table
| 2015 | 2016 | 2017 | 2018 | 2019 | 2020 | 2021 | 2022 | 2023 | 2024 | |
|---|---|---|---|---|---|---|---|---|---|---|
| Kazakhstan | 23,607 | 24,689 | 23,321 | 21,705 | 22,808 | 19,477 | 21,819 | 21,227 | 21,109 | 23,270 |
| Canada | 13,325 | 14,039 | 13,116 | 7,001 | 6,938 | 3,885 | 4,693 | 7,351 | 11,001 | 14,309 |
| Namibia | 2,993 | 3,654 | 4,224 | 5,525 | 5,476 | 5,413 | 5,753 | 5,611 | 6,986 | 7,333 |
| Australia | 5,654 | 6,315 | 5,882 | 6,517 | 6,613 | 6,203 | 4,192 | 4,553 | 4,693 | 4,598 |
| Uzbekistan | 2,385 | 3,325 | 3,400 | 3,450 | 3,500 | 3,500 | 3,516 | 3,561 | 4,000 | 4,000 |
| Russia | 3,055 | 3,004 | 2,917 | 2,904 | 2,911 | 2,846 | 2,635 | 2,508 | 2,710 | 2,738 |
| China | 1,616 | 1,616 | 1,692 | 1,885 | 1,885 | 1,885 | 1,600 | 1,700 | 1,600 | 1,600 |
| Niger | 4,116 | 3,479 | 3,449 | 2,911 | 2,983 | 2,991 | 2,248 | 2,020 | 1,130 | 962 |
| Ukraine | 1,200 | 808 | 707 | 790 | 800 | 744 | 455 | 100 | 340 | 288 |
| United States | 1,256 | 1,125 | 940 | 582 | 58 | 6 | 8 | 75 | 19 | 260 |
How world uranium production has changed since 2015
World mine production peaked at 63,207 tU in 2016 and then fell to 47,731 tU in 2020, 25% less, due to low prices, mine closures in Canada and Kazakhstan and the pandemic. It has since recovered: 49,614 tU in 2022, 54,433 in 2023 and 60,213 in 2024. The share of reactor demand covered by mines rose from 74% in 2020 to 90% in 2024.
| Year | World production (tU) | Demand covered by mines |
|---|---|---|
| 2015 | 60,342 | 98% |
| 2016 | 63,207 | 96% |
| 2017 | 60,462 | 93% |
| 2018 | 54,154 | 80% |
| 2019 | 54,742 | 81% |
| 2020 | 47,731 | 74% |
| 2021 | 47,805 | 76% |
| 2022 | 49,614 | 76% |
| 2023 | 54,433 | 83% |
| 2024 | 60,213 | 90% |
Source: World Nuclear Association. The gap between what is mined and what reactors consume is covered by company and government inventories, recycled uranium and material from dismantled nuclear weapons. A 1,000 MW reactor needs about 160 tU a year with current enrichment technologies, according to the Red Book parameters cited by the WNA.
The mines and companies that produce the most uranium
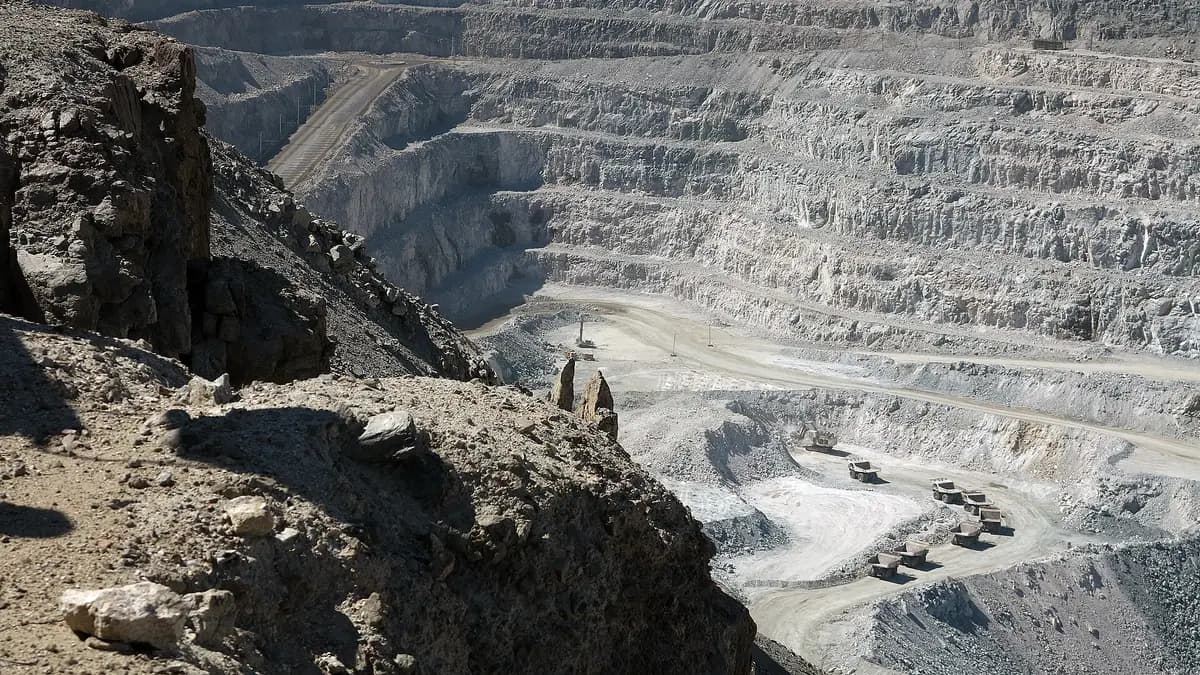
The ten largest mines produced 37,156 tU in 2024, 62% of the world total. By company, Kazatomprom (21%), Cameco (17%), Orano (11%), Uranium One (10%) and CGN (10%) account for almost seven out of ten tonnes. Olympic Dam, in Australia, extracts uranium as a by-product of copper, just as Chile obtains molybdenum from its copper mines.
| McArthur River/Key Lake | Canada | Cameco | 7,808 |
| Cigar Lake | Canada | Cameco/Orano | 6,501 |
| Husab | Namibia | Swakop Uranium (CGN) | 4,437 |
| Karatau (Budenovskoye 2) | Kazakhstan | Uranium One/Kazatomprom | 3,299 |
| Inkai 1-3 | Kazakhstan | Kazatomprom/Cameco | 2,992 |
| Akdala & South Inkai 4 | Kazakhstan | Uranium One/Kazatomprom | 2,803 |
| Olympic Dam | Australia | BHP | 2,693 |
| Moinkum & Tortkuduk | Kazakhstan | Orano/Kazatomprom | 2,388 |
| Rössing | Namibia | CNNC | 2,205 |
| Khorassan 1 | Kazakhstan | Kazatomprom/Uranium One | 2,030 |
| Company | Production 2024 (tU) | Share of total |
|---|---|---|
| Kazatomprom | 12,463 | 21% |
| Cameco | 10,193 | 17% |
| Orano | 6,815 | 11% |
| Uranium One | 5,829 | 10% |
| CGN | 5,761 | 10% |
| Navoi Mining | 4,000 | 7% |
| CNNC | 3,286 | 6% |
| Rosatom | 2,738 | 5% |
| BHP | 2,693 | 5% |
| General Atomics/Quasar | 1,808 | 3% |
| Others | 4,627 | 8% |
Source: World Nuclear Association. Some companies share mines, so production by company is allocated according to their stake.
Ownership is increasingly international: Chinese state companies CGN and CNNC control Namibia's two largest mines, while France's Orano and Canada's Cameco hold stakes in Kazakh operations. Russia's Rosatom, through Uranium One, is a partner in several Kazakh mines as well.
There are three main ways to mine uranium. In situ leaching dominates in Kazakhstan and Uzbekistan and is the most widely used method in the world; high-grade underground mines prevail in Canada, and open pits in Namibia. Uranium leaves the mine as an oxide concentrate, yellowcake, which is then converted, enriched and turned into reactor fuel pellets.
Does your company work in mining, energy or the energy transition? Reach Energía Futura's readers.
See advertising formatsUranium resources by country
Identified resources of uranium recoverable at under US$130 per kilo total 5.86 million tonnes as of 1 January 2025, according to the WNA, using data from the Red Book published by the OECD Nuclear Energy Agency and the International Atomic Energy Agency (IAEA). Australia holds 29%, although it produces less than 8%; it is followed by Kazakhstan (14%) and Canada (9%). At costs of up to US$260 per kilo, resources reach 8.1 million tonnes.
At current consumption of about 69,000 tonnes a year, the lowest-cost resources would last about 85 years. The WNA notes that resources grow as exploration advances and prices rise, as has happened with other critical minerals such as lithium, whose producer ranking is led by Australia.
Latin America's place in uranium production
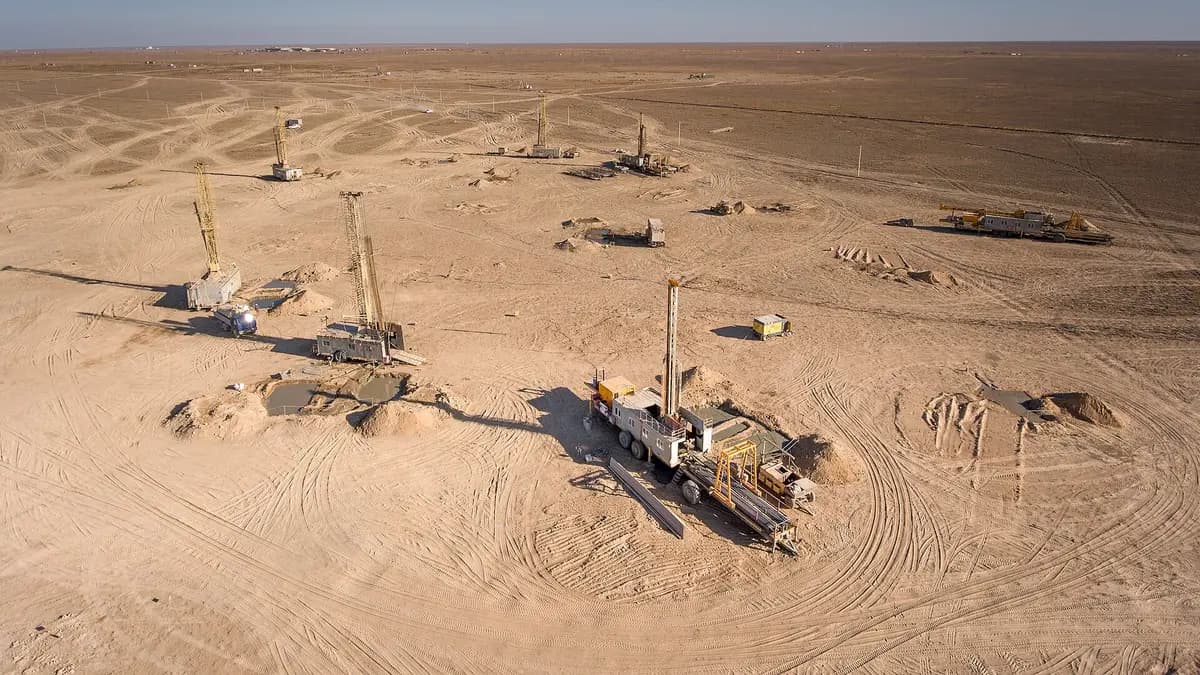
Latin America barely appears in the ranking. Brazil is the only country in the region with an operating mine: Caetité, in Bahia, run by state-owned INB, with a capacity of 340 tU a year, according to the WNA's Brazil profile. In 2022 it produced just 43 tU. It has resources of 167,800 tU (3% of the world, ninth place) and the Santa Quitéria project, in Ceará, is still in environmental licensing. Its Angra 1 and 2 plants total 1,884 MW.
Argentina produced 2,582 tU between the mid-1950s and 1997, when its last mine closed, according to the WNA's Argentina profile. The 2026 Red Book assigns it 15,850 tU of resources and the government declared in May 2026 that restarting uranium mining is a priority. It has three reactors (Atucha 1 and 2 and Embalse) with 1,631 MW, which generate about 7% of its electricity.
Chile does not produce uranium or have nuclear power plants. Its major contribution to transition minerals lies in copper and lithium: it is the world's largest copper producer, as shown in the ranking of copper producers, and the third in lithium, behind Australia and China. To see where all this uranium is used, read about the largest nuclear power plant in the world.
How to cite this data
Energía Futura (2026). "Largest uranium producers in the world 2026: country ranking, resources and Latin America's place". Updated on 5 November 2026. energiafutura.cl/en/news/largest-uranium-producers-in-the-world-2026-country-ranking-resources-and-latin-america. Data: World Nuclear Association; OECD-NEA and IAEA, Uranium 2026 (Red Book).
Frequently asked questions
Which country is the largest uranium producer?
Kazakhstan, with 23,270 tonnes in 2024, 38.6% of the world total, according to the World Nuclear Association.
How much uranium is produced in the world?
60,213 tonnes of uranium in 2024, 10.6% more than in 2023. It covers 90% of reactor demand.
Which country has the most uranium resources?
Australia, with 1.7 million tonnes of resources recoverable at under US$130 per kilo, 29% of the world total.
Does Latin America produce uranium?
Very little. Brazil has the region's only active mine, Caetité; Argentina stopped producing in 1997 and seeks to restart.
Does Chile produce uranium?
No. Chile has no operating uranium mines and no nuclear power plants.