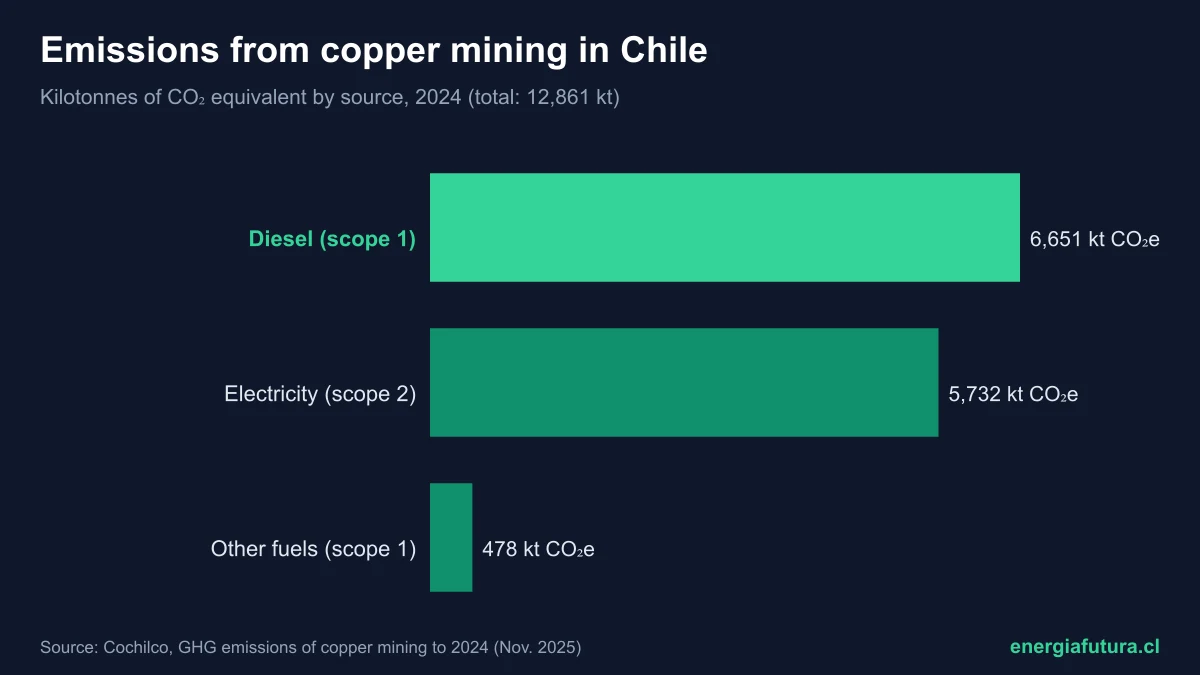
Updated on 26 October 2026. Copper mining in Chile emitted 12,861 kilotonnes of CO2 equivalent in 2024, the lowest level since 2010, according to the report Greenhouse gas emissions from copper mining up to 2024, published by Cochilco in November 2025. Each tonne of fine copper produced carries about 2.33 tonnes of CO2 equivalent: 1.29 from fuels burned on site and 1.04 from the electricity it buys.
The figure has two sides. Emissions from electricity are falling fast because Chile's grid is increasingly renewable, while those from diesel keep rising because mines are deeper and move more rock. Cochilco calculates them using the EMPAE survey of 49 large and mid-size operations, 98% of national output, and the 2006 IPCC methodology.
The carbon footprint of Chilean copper in 2024
| Component (2024) | kt CO2e | Share |
|---|---|---|
| Direct emissions (scope 1) | 7,129 | 55% |
| Of which: diesel | 6,651 | 93.3% of direct |
| Of which: other fuels | 478 | 6.7% of direct |
| Indirect emissions from electricity (scope 2) | 5,732 | 45% |
| Total | 12,861 | 100% |
Source: Cochilco (November 2025). Direct emissions are obtained by subtracting indirect emissions from the reported total. Between 2010 and 2024, direct emissions grew by an average of 3.7% a year and indirect emissions fell 4.5%, so the total declined 1.2% a year.
A carbon footprint is the sum of the greenhouse gases generated by an activity, expressed in CO2 equivalent. For mining, Cochilco measures scopes 1 and 2: what is burned on site and the electricity bought. It does not include scope 3, such as shipping concentrate or smelting abroad.
How much CO2 each tonne of copper emits by product
Emissions per tonne depend heavily on what is produced. Electrowon cathodes (SX-EW) have the lowest direct emissions, because their process is almost entirely electric; smelter anodes are in between. The coefficient for the whole operation, from mine to final product, is the highest because it includes hauling rock in the pits.
| Coefficient (2024) | t CO2e per t of fine copper |
|---|---|
| Direct emissions per fine copper produced | 1.29 |
| Direct emissions per copper in blister or anodes | 0.38 |
| Direct emissions per electrowon cathodes | 0.23 |
| Indirect emissions per fine copper produced | 1.04 |
| Sum of direct and indirect per fine copper | 2.33 |
Source: Cochilco (November 2025). The sum is an Energía Futura calculation using the report's two coefficients. The indirect coefficient fell 16% from 2023 and 44.5% from 2018.
Electricity is getting cleaner: the emission factor fell 52%
Since 2018, all copper mining has been supplied by the National Electric System (SEN), which merged the former northern (SING) and central-southern (SIC) grids. Its emission factor, that is, how much CO2 is emitted per MWh generated, fell from 0.4187 t CO2e/MWh in 2018 to 0.2017 in 2024, about 52% less in six years. The reason is the growth of solar and wind power in the north and the exit of coal plants.
| Year | SEN emission factor (t CO2e/MWh) |
|---|---|
| 2018 | 0.4187 |
| 2019 | 0.4056 |
| 2020 | 0.3834 |
| 2021 | 0.3907 |
| 2022 | 0.3006 |
| 2023 | 0.2421 |
| 2024 | 0.2017 |
Source: Cochilco, table 1 of the emissions report to 2024. Since the merger, mining's indirect emissions have fallen by an average of 10.2% a year. In Antofagasta, the largest mining region, they dropped 66.7% over the last decade.
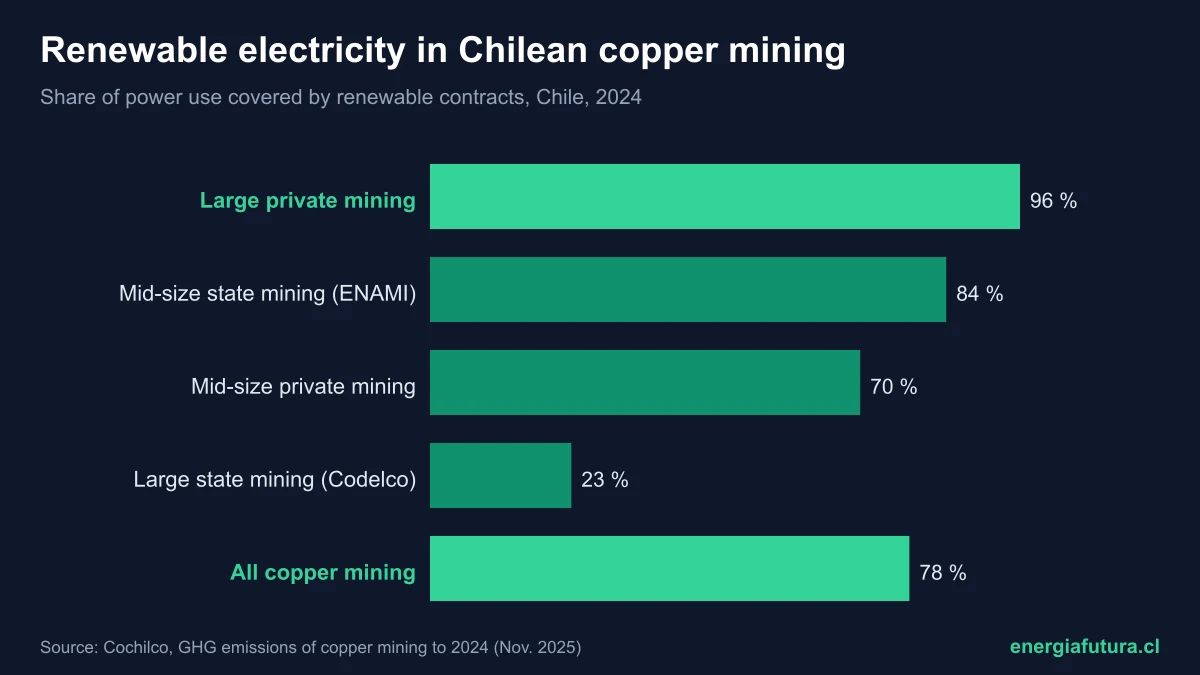
Beyond the grid, contracts also matter: 78% of the sector's power use was backed by renewable energy in 2024 and 80.1% in 2025. The breakdown by company is in how much renewable energy each major Chilean miner uses. The concentrator is the process that uses the most electricity (56% of the total in 2024), followed by hydrometallurgy (15%) and seawater pumping and desalination (11%).
Diesel is rising: the big gap in the carbon footprint of copper
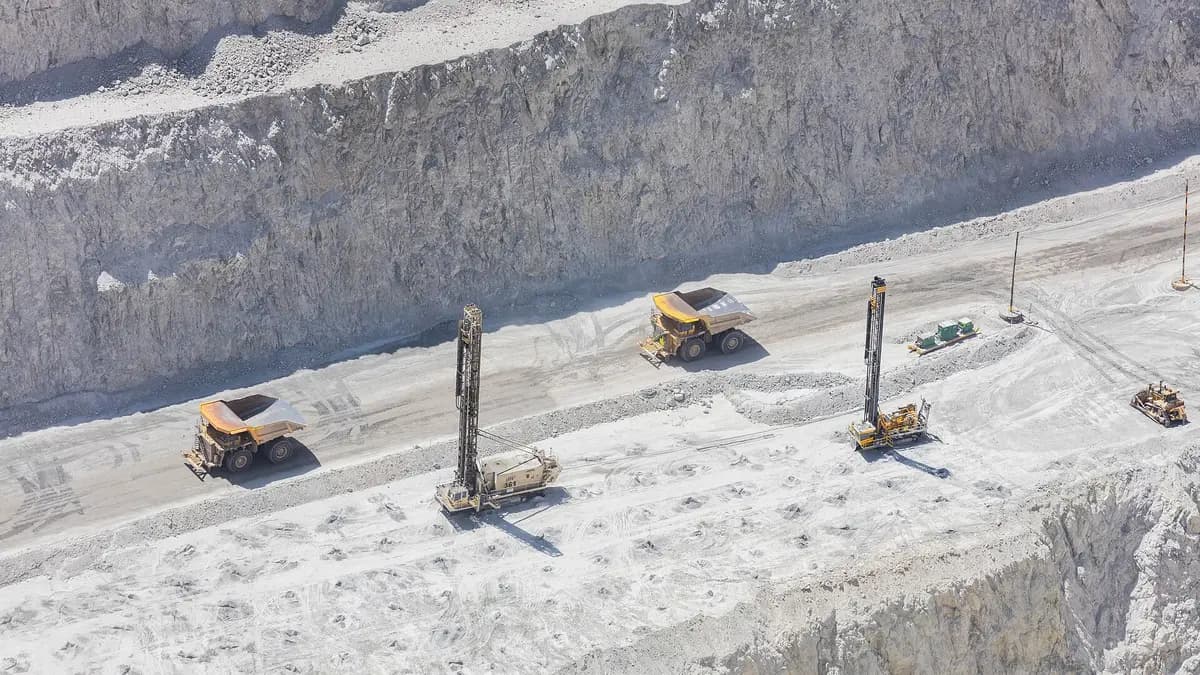
Direct emissions are going the other way. Between 2022 and 2024 they rose from 6.63 to 7.13 million tonnes of CO2 equivalent. Fuel consumption in 2024 was 60.2% higher than in 2010, and fuel energy per tonne of copper rose from 13.8 to 17.7 PJ per million tonnes between 2014 and 2024. 82% of direct emissions come from open-pit mining.
Cochilco attributes the rise to structural factors: lower ore grades, more waste rock to move to reach the ore, and deeper pits with longer haul distances. In 2025, the sector used 210.6 PJ of energy and its intensity reached 39.1 GJ per tonne of fine copper, 36% more than in 2015, according to the energy report to 2025.
That is why the report concludes that future decarbonisation will depend on electrifying mining processes: electric trucks, trolley systems, hybrid fleets and green hydrogen. Trials are under way at several Chilean mines, and technician training for that shift is covered in the University of Chile's mining electromobility project.
How the carbon footprint of Chilean copper compares with the world
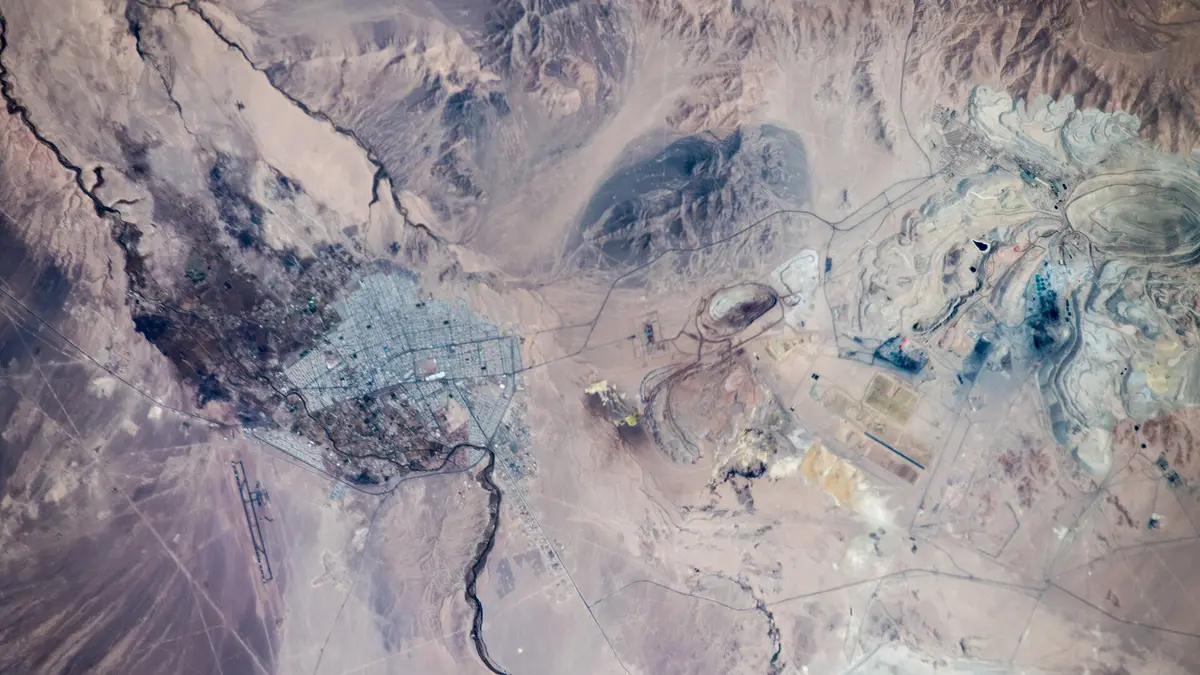
There is no free public database comparing copper's footprint country by country with the same methodology. The available references use different boundaries, so they serve as an order of magnitude rather than a ranking.
| Reference | Value | What it includes | Source |
|---|---|---|---|
| Chilean copper mining (2024) | 2.33 t CO2e/t | Scopes 1 and 2, whole operation, per fine copper produced | Cochilco |
| World average for primary copper mines (2024) | 2.37 t CO2e/t | Scopes 1 and 2, per payable tonne | S&P Global Market Intelligence (2025) |
| World average for refined copper (2018) | 4.6 t CO2e/t | Scopes 1, 2 and 3, cradle to gate, including refining | International Copper Association, cited by IISD (2026) |
Within those boundaries, Chilean copper sits around the world average for primary mines estimated by S&P Global Market Intelligence, which also reported that the figure fell 8% between 2023 and 2024 due to grid decarbonisation. The International Copper Association figure is higher because it adds smelting, refining and scope 3; according to the IISD copper profile, 46% of refined copper's footprint comes from electricity, 24% from own fuels and 30% from the supply chain.
Chile produces about a quarter of the world's copper, as shown in the ranking of the largest copper producers, so its footprint weighs on that of the metal globally. For buyers who demand traceability, Chile's advantage lies in renewable electricity; its disadvantage, in ageing mines that need ever more diesel.
The targets
Chile has committed to carbon neutrality by 2050. Codelco, the largest producer, estimates that 100% renewable electricity would avoid about 2.78 million tonnes of CO2 equivalent a year, and projected more than 85% renewable electricity from 2026. Large private miners already report 100% renewable electricity, so their next target is scope 1.
Methodology
The Chilean figures are from Cochilco and refer to 2024, the latest year published; 2025 emissions will be known with the next report. The cover chart uses the breakdown by source from the same report. This page will be updated at the same address when new data are available.
Does your company offer solutions to cut emissions in mining? Reach Energía Futura's readers.
See advertising optionsFrequently asked questions
How much CO2 does copper mining emit in Chile?
12,861 kilotonnes of CO2 equivalent in 2024, the lowest level since 2010, according to Cochilco.
What is the carbon footprint of a tonne of Chilean copper?
About 2.33 tonnes of CO2 equivalent per tonne of fine copper, adding direct emissions (1.29) and those from electricity (1.04).
Which part of mining emits the most?
Diesel from trucks and equipment in open pits: 6,651 kt in 2024, 93.3% of direct emissions.
Why are emissions falling if mining uses more energy?
Because grid electricity emits half as much as in 2018 and 80% of the sector's power use is covered by renewable contracts.
Is Chilean copper cleaner than the rest of the world's?
It is around the world average for primary mines estimated by S&P Global (2.37 t per tonne), although the methodologies are not identical.
How to cite this data
Energía Futura (2026). Carbon footprint of Chilean copper 2026: how much CO2 mining emits per tonne. With data from Cochilco (GHG emissions from copper mining to 2024; Energy consumption to 2025), S&P Global Market Intelligence, International Copper Association and IISD, accessed on 26 October 2026. Available at https://energiafutura.cl/en/news/carbon-footprint-of-chilean-copper-2026-how-much-co2-mining-emits-per-tonne. The cover chart may be reproduced by citing Energía Futura and linking to this page.