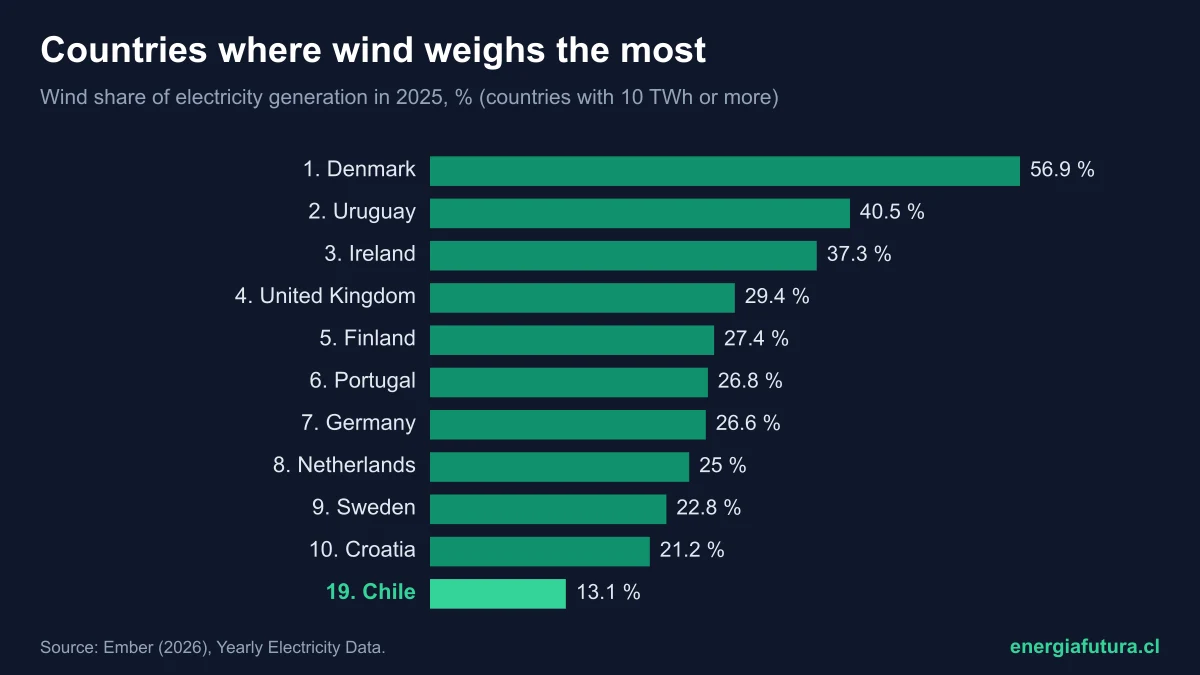
Updated on 16 November 2026. Denmark is the country where wind power weighs most in electricity: it generated 56.9% of its electricity from wind in 2025, according to annual data from Ember, the British think tank that compiles official statistics for each country. It is followed by Uruguay, with 40.5%, the Latin American leader, and Ireland, with 37.3%. Chile ranks 19th, with 13.1%, above the world average of 8.5%.
The ranking measures what share of each country's electricity comes from wind, not how many turbines it has. That is why China, which generates more wind power than anyone, only appears in 25th place. This data sheet brings together the 2025 ranking of the 79 countries that generate at least 10 TWh a year and have 2025 data, how it has changed since 2010, the situation in Latin America and Chile's place.
View the data as a table
| Denmark, first | 56.9% |
| Uruguay, second | 40.5% |
| Chile, 19th | 13.1% |
| World average | 8.5% |
Ranking of countries with the highest share of wind power in electricity
The table ranks countries by the percentage of their electricity generated by onshore and offshore wind farms in 2025. The last column shows their 2024 position on the same basis.
| # | Country | Wind share 2025 | Wind generation 2025 (TWh) | Capacity (GW) | 2024 rank |
|---|---|---|---|---|---|
| 1 | Denmark | 56.9% | 20.3 | 7.6 | 1 |
| 2 | Uruguay | 40.5% | 4.9 | 1.5 | 2 |
| 3 | Ireland | 37.3% | 11.8 | 5.1 | 3 |
| 4 | United Kingdom | 29.4% | 86.4 | 33.4 | 5 |
| 5 | Finland | 27.4% | 22.6 | 9.4 | 8 |
| 6 | Portugal | 26.8% | 13.7 | 5.6 | 4 |
| 7 | Germany | 26.6% | 132.3 | 77.8 | 6 |
| 8 | Netherlands | 25.0% | 33.7 | 11.8 | 7 |
| 9 | Sweden | 22.8% | 38.9 | 17.4 | 9 |
| 10 | Croatia | 21.2% | 3.1 | 1.4 | 13 |
| 19 | Chile | 13.1% | 11.6 | 5.9 | 19 |
Source: Ember (2026), Yearly Electricity Data. Countries generating at least 10 TWh a year.
Denmark has generated more than 40% of its electricity from wind since 2014, with farms in the North Sea and the Baltic and a grid closely linked to Norway, Sweden and Germany, which lets it export surpluses and buy power when the wind drops. In 2025 its share dipped slightly from 58.4% because it was a less windy year in northern Europe: the same happened in Portugal, Germany, the Netherlands and Spain. The biggest risers were Croatia (+3.7 points) and Finland (+2.7 points).
View the data as a table
| Denmark | 56.9% |
| Uruguay | 40.5% |
| Ireland | 37.3% |
| United Kingdom | 29.4% |
| Finland | 27.4% |
| Portugal | 26.8% |
| Germany | 26.6% |
| Netherlands | 25.0% |
| Sweden | 22.8% |
| Croatia | 21.2% |
| Greece | 20.9% |
| Spain | 20.4% |
| Belgium | 18.6% |
| Kenya | 16.5% |
| Morocco | 15.2% |
| Brazil | 15.2% |
| Poland | 13.9% |
| Australia | 13.8% |
| Chile | 13.1% |
| Argentina | 12.2% |
| Romania | 12.0% |
| Costa Rica | 12.0% |
| Austria | 11.4% |
| Türkiye | 11.1% |
| People's Republic of China | 10.7% |
| United States | 10.3% |
| New Zealand | 9.6% |
| France | 8.8% |
| Norway | 8.4% |
| Italy | 8.1% |
| Canada | 8.0% |
| Dominican Republic | 6.2% |
| Mexico | 5.6% |
| India | 5.0% |
| South Africa | 4.7% |
| Uzbekistan | 4.6% |
| Vietnam | 4.5% |
| Taiwan | 4.2% |
| Egypt | 4.1% |
| Serbia | 4.1% |
| Kazakhstan | 4.1% |
| Bulgaria | 3.5% |
| Peru | 3.5% |
| Ethiopia | 3.3% |
| Bosnia and Herzegovina | 2.6% |
| Sri Lanka | 2.4% |
| Pakistan | 2.2% |
| Kuwait | 2.1% |
| Bolivia | 2.0% |
| Thailand | 1.8% |
| Hungary | 1.5% |
| Tunisia | 1.3% |
| Japan | 1.3% |
| Philippines | 1.2% |
| Puerto Rico | 1.1% |
| Czech Republic | 0.8% |
| Georgia | 0.7% |
| South Korea | 0.6% |
| Israel | 0.6% |
| Ecuador | 0.5% |
| Belarus | 0.5% |
| Azerbaijan | 0.3% |
| Saudi Arabia | 0.3% |
| Russia | 0.3% |
| Iran | 0.3% |
| Switzerland | 0.2% |
| Oman | 0.2% |
| Colombia | 0.2% |
| United Arab Emirates | 0.1% |
| Slovenia | 0.1% |
| Indonesia | 0.1% |
| Iceland | 0.0% |
| Bangladesh | 0.0% |
| Kyrgyzstan | 0.0% |
| Malaysia | 0.0% |
| Nigeria | 0.0% |
| Paraguay | 0.0% |
| Slovakia | 0.0% |
| Tajikistan | 0.0% |
In all, 26 countries generate more than 10% of their electricity from wind and 12 exceed 20%; almost all are in Europe. Outside it are Uruguay, Kenya (16.5%), Morocco (15.2%), Brazil (15.2%), Australia (13.8%) and Chile. The full sheet, with all 79 countries, can be sorted and searched in the following table.
| 1 | Denmark | 56.9% | 20.3 | 7.6 |
| 2 | Uruguay | 40.5% | 4.9 | 1.5 |
| 3 | Ireland | 37.3% | 11.8 | 5.1 |
| 4 | United Kingdom | 29.4% | 86.4 | 33.4 |
| 5 | Finland | 27.4% | 22.6 | 9.4 |
| 6 | Portugal | 26.8% | 13.7 | 5.6 |
| 7 | Germany | 26.6% | 132.3 | 77.8 |
| 8 | Netherlands | 25.0% | 33.7 | 11.8 |
| 9 | Sweden | 22.8% | 38.9 | 17.4 |
| 10 | Croatia | 21.2% | 3.1 | 1.4 |
| 11 | Greece | 20.9% | 12.1 | 5.7 |
| 12 | Spain | 20.4% | 58.8 | 33.3 |
| 13 | Belgium | 18.6% | 13.4 | 5.9 |
| 14 | Kenya | 16.5% | 2.3 | 0.4 |
| 15 | Morocco | 15.2% | 6.7 | 2.5 |
| 16 | Brazil | 15.2% | 115.8 | 34.9 |
| 17 | Poland | 13.9% | 24.0 | 10.6 |
| 18 | Australia | 13.8% | 39.6 | 16.4 |
| 19 | Chile | 13.1% | 11.6 | 5.9 |
| 20 | Argentina | 12.2% | 18.6 | 4.5 |
| 21 | Romania | 12.0% | 6.0 | 3.3 |
| 22 | Costa Rica | 12.0% | 1.6 | 0.4 |
| 23 | Austria | 11.4% | 8.3 | 4.3 |
| 24 | Turkey | 11.1% | 39.4 | 14.8 |
| 25 | People's Republic of China | 10.7% | 1,127.9 | 640.6 |
| 26 | United States | 10.3% | 464.4 | 158.8 |
| 27 | New Zealand | 9.6% | 4.2 | 1.3 |
| 28 | France | 8.8% | 50.7 | 25.7 |
| 29 | Norway | 8.4% | 13.6 | 5.2 |
| 30 | Italy | 8.1% | 21.5 | 13.6 |
| 31 | Canada | 8.0% | 52.6 | 17.7 |
| 32 | Dominican Republic | 6.2% | 1.4 | 0.5 |
| 33 | Mexico | 5.6% | 21.8 | 7.5 |
| 34 | India | 5.0% | 104.0 | 54.5 |
| 35 | South Africa | 4.7% | 11.3 | 4.3 |
| 36 | Uzbekistan | 4.6% | 4.0 | 1.7 |
| 37 | Vietnam | 4.5% | 14.7 | No data |
| 38 | Taiwan | 4.2% | 12.2 | 4.5 |
| 39 | Egypt | 4.1% | 9.9 | 3.0 |
| 40 | Serbia | 4.1% | 1.5 | 0.8 |
| 41 | Kazakhstan | 4.1% | 5.1 | 1.9 |
| 42 | Bulgaria | 3.5% | 1.3 | 0.7 |
| 43 | Peru | 3.5% | 2.1 | 1.3 |
| 44 | Ethiopia | 3.3% | 1.1 | 0.5 |
| 45 | Bosnia and Herzegovina | 2.6% | 0.4 | 0.2 |
| 46 | Sri Lanka | 2.4% | 0.4 | No data |
| 47 | Pakistan | 2.2% | 3.7 | 1.9 |
| 48 | Kuwait | 2.1% | 1.9 | 0.0 |
| 49 | Bolivia | 2.0% | 0.3 | 0.1 |
| 50 | Thailand | 1.8% | 3.6 | 1.5 |
| 51 | Hungary | 1.5% | 0.6 | 0.3 |
| 52 | Tunisia | 1.3% | 0.3 | 0.3 |
| 53 | Japan | 1.3% | 12.8 | 6.2 |
| 54 | Philippines | 1.2% | 1.5 | 0.5 |
| 55 | Puerto Rico | 1.1% | 0.2 | 0.1 |
| 56 | Czechia | 0.8% | 0.6 | 0.4 |
| 57 | Georgia | 0.7% | 0.1 | 0.0 |
| 58 | South Korea | 0.6% | 3.7 | 2.5 |
| 59 | Israel | 0.6% | 0.5 | 0.4 |
| 60 | Ecuador | 0.5% | 0.2 | 0.1 |
| 61 | Belarus | 0.5% | 0.2 | 0.1 |
| 62 | Azerbaijan | 0.3% | 0.1 | 0.1 |
| 63 | Saudi Arabia | 0.3% | 1.6 | No data |
| 64 | Russia | 0.3% | 3.9 | 2.9 |
| 65 | Iran | 0.3% | 1.2 | 0.4 |
| 66 | Switzerland | 0.2% | 0.2 | 0.1 |
| 67 | Oman | 0.2% | 0.1 | 0.1 |
| 68 | Colombia | 0.2% | 0.2 | 0.0 |
| 69 | United Arab Emirates | 0.1% | 0.2 | No data |
| 70 | Slovenia | 0.1% | 0.0 | 0.0 |
| 71 | Indonesia | 0.1% | 0.4 | No data |
| 72 | Iceland | 0.0% | 0.0 | No data |
| 73 | Bangladesh | 0.0% | 0.0 | 0.1 |
| 74 | Kyrgyzstan | 0.0% | 0.0 | No data |
| 75 | Malaysia | 0.0% | 0.0 | 0.0 |
| 76 | Nigeria | 0.0% | 0.0 | 0.0 |
| 77 | Paraguay | 0.0% | 0.0 | 0.0 |
| 78 | Slovakia | 0.0% | 0.0 | 0.0 |
| 79 | Tajikistan | 0.0% | 0.0 | 0.0 |
How wind's share has changed since 2010
In 2015 wind generated 3.4% of the world's electricity. In 2025 it reached 8.5%, with 2,705 TWh, adding 199 TWh in the last year. Wind grew more slowly than solar: in 2025, for the first time, the sun generated more electricity than the wind worldwide (2,807 TWh versus 2,705 TWh).
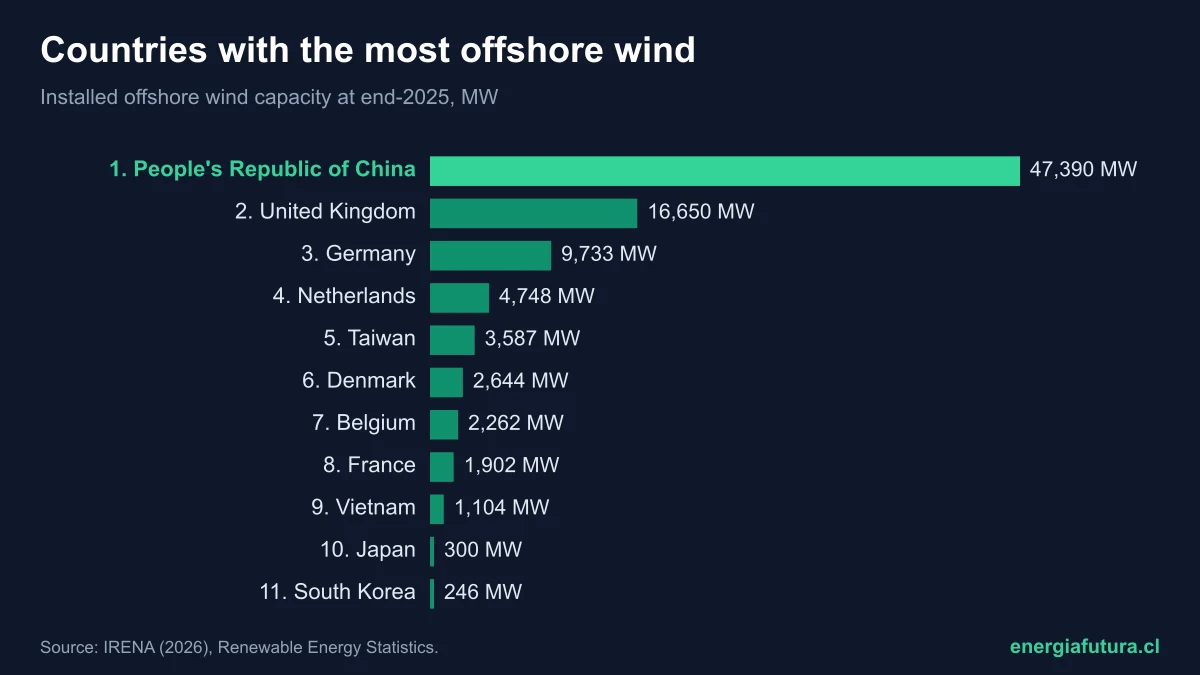
The race shows that wind leadership is more stable than solar's. Denmark has topped the list since 2010; Portugal, Spain and Ireland have always been near the top. The big change was Uruguay, which went from 1.2% in 2013 to 32.4% in 2018 with state-driven long-term auctions, one of the fastest power-mix shifts in the world. The United Kingdom rose from 2.7% in 2010 to 29.4% thanks to offshore wind, as our ranking of the countries with the most offshore wind shows.
View the data as a table
| 2010 | 2011 | 2012 | 2013 | 2014 | 2015 | 2016 | 2017 | 2018 | 2019 | 2020 | 2021 | 2022 | 2023 | 2024 | 2025 | |
|---|---|---|---|---|---|---|---|---|---|---|---|---|---|---|---|---|
| Denmark | 20.2% | 27.8% | 33.6% | 32.1% | 40.8% | 49.1% | 42.0% | 47.8% | 46.0% | 55.0% | 57.1% | 48.8% | 54.1% | 57.2% | 58.4% | 56.9% |
| Uruguay | 0.7% | 1.1% | 1.0% | 1.2% | 5.6% | 15.1% | 21.6% | 26.3% | 32.4% | 29.6% | 40.4% | 31.2% | 32.2% | 37.1% | 38.6% | 40.5% |
| Ireland | 10.2% | 16.4% | 15.0% | 18.0% | 20.2% | 23.7% | 20.6% | 24.6% | 28.3% | 33.0% | 36.5% | 31.3% | 33.7% | 37.6% | 37.3% | 37.3% |
| United Kingdom | 2.7% | 4.3% | 5.5% | 7.9% | 9.5% | 11.9% | 11.0% | 14.7% | 17.1% | 19.5% | 24.4% | 21.1% | 24.7% | 28.2% | 29.4% | 29.4% |
| Finland | 0.4% | 0.7% | 0.7% | 1.1% | 1.6% | 3.4% | 4.5% | 7.1% | 8.3% | 8.8% | 11.9% | 11.8% | 16.7% | 18.4% | 24.8% | 27.4% |
| Portugal | 17.2% | 17.7% | 22.6% | 23.9% | 23.4% | 22.7% | 21.1% | 21.3% | 21.6% | 26.5% | 23.9% | 26.8% | 28.6% | 28.5% | 30.4% | 26.8% |
| Germany | 6.2% | 8.2% | 8.3% | 8.4% | 9.5% | 12.6% | 12.5% | 16.4% | 17.4% | 21.0% | 23.3% | 19.7% | 22.0% | 27.7% | 27.9% | 26.6% |
| Netherlands | 3.4% | 4.5% | 4.9% | 5.6% | 5.7% | 6.9% | 7.2% | 9.1% | 9.3% | 9.6% | 12.5% | 15.0% | 18.0% | 24.6% | 27.4% | 25.0% |
| Sweden | 2.4% | 4.1% | 4.3% | 6.4% | 7.3% | 10.1% | 9.9% | 10.7% | 10.2% | 11.8% | 16.8% | 15.9% | 19.2% | 20.6% | 23.5% | 22.8% |
| Croatia | 0.9% | 1.8% | 3.1% | 3.7% | 5.4% | 7.1% | 8.0% | 10.2% | 9.9% | 11.6% | 13.0% | 13.6% | 15.2% | 14.9% | 17.5% | 21.2% |
| Greece | 4.8% | 5.7% | 6.4% | 7.3% | 7.4% | 9.1% | 9.6% | 10.1% | 12.0% | 15.2% | 19.6% | 19.3% | 21.1% | 22.5% | 22.0% | 20.9% |
| Spain | 14.9% | 14.7% | 16.8% | 19.8% | 19.0% | 17.8% | 18.1% | 18.0% | 18.8% | 20.6% | 21.8% | 22.9% | 21.9% | 23.0% | 22.1% | 20.4% |
| People's Republic of China | 1.2% | 1.6% | 2.1% | 2.6% | 2.8% | 3.2% | 3.9% | 4.6% | 5.1% | 5.4% | 6.0% | 7.7% | 8.7% | 9.4% | 9.9% | 10.7% |
| United States | 2.3% | 2.9% | 3.5% | 4.1% | 4.4% | 4.7% | 5.6% | 6.3% | 6.5% | 7.1% | 8.4% | 9.1% | 10.1% | 9.9% | 10.3% | 10.3% |
| Chile | 0.5% | 0.5% | 0.6% | 0.8% | 2.1% | 2.8% | 3.1% | 4.5% | 4.4% | 5.8% | 6.6% | 8.6% | 9.8% | 10.6% | 11.8% | 13.1% |
By volume, China rules: 1,128 TWh of wind power in 2025, 10.7% of its electricity. It is followed by the United States (464 TWh, 10.3%) and Germany (132 TWh, 26.6%). The world's biggest single projects are in our ranking of the largest wind farm in the world.
Does your company develop wind farms, transmission or storage? Reach Energía Futura's readers.
See advertising optionsWind power in Latin America
Uruguay leads Latin America and is second in the world, with 40.5%. It is followed by Brazil (15.2%, the world's fourth-largest wind generator by volume, with 116 TWh), Chile (13.1%), Argentina (12.2%) and Costa Rica (12%). Further back are the Dominican Republic (6.2%), Mexico (5.6%) and Peru (3.5%). Colombia, despite the winds of La Guajira, generates just 0.2%: its large wind farms are still delayed.
| Country | Wind share 2025 | Generation (TWh) | World rank |
|---|---|---|---|
| Uruguay | 40.5% | 4.9 | 2 |
| Brazil | 15.2% | 115.8 | 16 |
| Chile | 13.1% | 11.6 | 19 |
| Argentina | 12.2% | 18.6 | 20 |
| Costa Rica | 12.0% | 1.6 | 22 |
| Dominican Republic | 6.2% | 1.4 | 32 |
| Mexico | 5.6% | 21.8 | 33 |
| Peru | 3.5% | 2.1 | 43 |
Source: Ember (2026). Panama (7.1% in 2024) and Honduras (6% in 2024) do not yet have 2025 data.
Chile's place among the countries with the highest share of wind power
Chile generated 13.1% of its electricity from wind in 2025, 11.6 TWh, up from 11.8% in 2024, though it stayed in 19th place. In 2013 wind supplied just 0.8%. According to the Generadoras de Chile bulletin for September 2026, based on National Electricity Coordinator data, the country had 6,423 MW of wind capacity in operation as of July 2026, and wind supplied 15.6% of September's generation. On 4 September at 18:00 it covered 41.7% of demand, with 3,642 MW generating at once.
View the data as a table
| Chile | Denmark | Uruguay | World | |
|---|---|---|---|---|
| 2010 | 0.5% | 20.2% | 0.7% | 1.6% |
| 2011 | 0.5% | 27.8% | 1.1% | 2.0% |
| 2012 | 0.6% | 33.6% | 1.0% | 2.3% |
| 2013 | 0.8% | 32.1% | 1.2% | 2.7% |
| 2014 | 2.1% | 40.8% | 5.6% | 3.0% |
| 2015 | 2.8% | 49.1% | 15.1% | 3.4% |
| 2016 | 3.1% | 42.0% | 21.6% | 3.9% |
| 2017 | 4.5% | 47.8% | 26.3% | 4.5% |
| 2018 | 4.4% | 46.0% | 32.4% | 4.8% |
| 2019 | 5.8% | 55.0% | 29.6% | 5.3% |
| 2020 | 6.6% | 57.1% | 40.4% | 5.9% |
| 2021 | 8.6% | 48.8% | 31.2% | 6.5% |
| 2022 | 9.8% | 54.1% | 32.2% | 7.3% |
| 2023 | 10.6% | 57.2% | 37.1% | 7.8% |
| 2024 | 11.8% | 58.4% | 38.6% | 8.1% |
| 2025 | 13.1% | 56.9% | 40.5% | 8.5% |
Like solar, Chilean wind is concentrated in the north: Antofagasta supplied 40% of September's wind generation, Atacama 18% and La Araucanía 13%. One advantage of northern wind is that it blows hard in the late afternoon, just as solar output falls.
Wind and solar together: the combined ranking
Adding wind and solar together, Chile rises to 9th in the world: wind and sun together generated 38.1% of its electricity in 2025, more than twice the world average of 17.3%. Denmark remains first, with 69.7%, followed by the Netherlands (46.1%), Uruguay (45.7%), Germany (44.7%) and Portugal (44.1%). The two sources complement each other: the sun covers midday and the wind tends to pick up in the afternoon and in winter. How all renewables compare is in our ranking of the countries with the most renewable energy.
The limit is no longer so much the resource as the grid. When there is more wind and sun than transmission can carry to consumption centres, the Coordinator orders generation to be cut. According to Generadoras de Chile, those cuts totalled 316.7 GWh in the month reported in its September bulletin, 11.1% of all wind and solar generation. More batteries and new lines, such as Kimal-Lo Aguirre, are the missing pieces for wind's share to keep rising.
Methodology
The data come from Ember, which compiles official electricity generation statistics by country (national agencies, Eurostat, the US EIA and the IEA, among others), from its annual dataset downloaded on 16 November 2026. The ranking uses 2025 and covers the 79 countries that generate at least 10 TWh a year and already have 2025 data, so that very small countries do not distort the comparison. Among those generating over 10 TWh, 27 countries do not yet have 2025 data, such as Iraq, Algeria, Venezuela, Jordan (7.4% wind in 2024), Panama and Honduras; none would have made the top 10. The wind category includes onshore and offshore farms. Chile's MW figures are from the CNE via Generadoras de Chile and may differ from Ember's GW estimates.
How to cite this data
Energía Futura (2026). "Countries with the highest share of wind power in electricity 2026: world ranking and Chile's place". Updated on 16 November 2026. energiafutura.cl/en/news/countries-with-the-highest-share-of-wind-power-in-electricity-2026-world-ranking-and-chile. Data: Ember (2026), Yearly Electricity Data.
Frequently asked questions
In which country does wind weigh most in electricity?
Denmark, which generated 56.9% of its electricity from wind in 2025, according to Ember.
Where does Chile rank?
19th, with 13.1% of its electricity (11.6 TWh) in 2025, above the world average of 8.5%.
Which Latin American country has the most wind in its power mix?
Uruguay, with 40.5%, second in the world. It is followed by Brazil (15.2%) and Chile (13.1%).
How much of the world's electricity comes from wind?
8.5% in 2025, with 2,705 TWh. In 2015 it was 3.4%.
Which country generates the most wind power?
China, with 1,128 TWh in 2025, 10.7% of its electricity.
How much electricity does Chile generate from wind and sun together?
38.1% in 2025 (25.1% solar and 13.1% wind), the ninth-highest share in the world according to Ember.
How many MW of wind capacity does Chile have?
6,423 MW in operation as of July 2026, according to Generadoras de Chile with National Electricity Coordinator data.