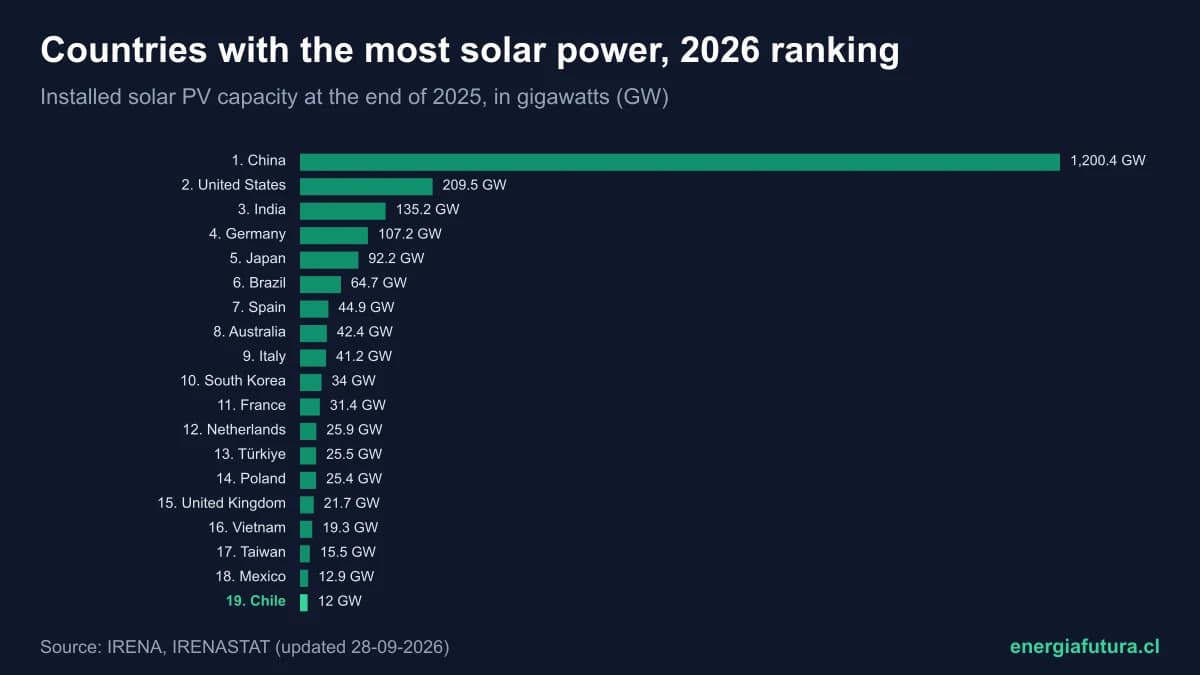
Updated on October 18, 2026. China has 1,200 GW of installed solar photovoltaic capacity, 50.3% of all solar capacity in the world, according to the IRENASTAT database of the International Renewable Energy Agency (IRENA), with end-2025 figures. It is followed by the United States (209.5 GW) and India (135.2 GW). Chile ranks 19th with 12 GW, third in Latin America after Brazil and Mexico.
The world ended 2025 with 2,388 GW of solar PV, according to the sum of IRENA's country data. In its 2026 renewable capacity report, the agency said solar grew by 511 GW (27.2%) in 2025 and accounted for about three-quarters of all renewable expansion that year. This is the full ranking of countries by solar power.
World ranking of countries by solar power: the top 20
The table ranks countries by installed solar PV capacity at the end of 2025, on-grid or off-grid. It is the standard measure for comparing the size of each country's solar fleet. The data were downloaded from IRENASTAT, in the version updated on September 28, 2026.
| # | Country | Solar capacity 2025 (GW) | Capacity 2024 (GW) | Growth in 2025 |
|---|---|---|---|---|
| 1 | China | 1,200.4 | 886.1 | +35.5% |
| 2 | United States | 209.5 | 175.5 | +19.4% |
| 3 | India | 135.2 | 97.2 | +39.0% |
| 4 | Germany | 107.2 | 91.2 | +17.5% |
| 5 | Japan | 92.2 | 89.6 | +2.9% |
| 6 | Brazil | 64.7 | 53.1 | +21.8% |
| 7 | Spain | 44.9 | 35.9 | +25.2% |
| 8 | Australia | 42.4 | 37.4 | +13.6% |
| 9 | Italy | 41.2 | 35.4 | +16.2% |
| 10 | South Korea | 34.0 | 30.4 | +12.1% |
| 11 | France | 31.4 | 25.7 | +22.5% |
| 12 | Netherlands | 25.9 | 24.8 | +4.5% |
| 13 | Türkiye | 25.5 | 20.2 | +25.9% |
| 14 | Poland | 25.4 | 21.7 | +17.0% |
| 15 | United Kingdom | 21.7 | 19.0 | +14.7% |
| 16 | Vietnam | 19.3 | 18.7 | +3.1% |
| 17 | Taiwan | 15.5 | 14.3 | +8.4% |
| 18 | Mexico | 12.9 | 12.0 | +7.8% |
| 19 | Chile | 12.0 | 10.9 | +10.3% |
| 20 | Saudi Arabia | 11.9 | 6.2 | +93.2% |
The top ten account for 1,972 GW, 82.6% of the world's solar capacity. Without China, the rest of the planet has about 1,188 GW: China alone has more solar power than all other countries combined.
China: the country with the most solar power in the world
China added 314 GW of solar in a single year, more than the entire installed capacity of the United States and almost as much as the United States and India combined (345 GW). To put it in perspective: China's 2025 addition equals 26 times Chile's entire solar capacity. The country also dominates manufacturing: it produces most of the world's panels, cells and silicon wafers, which has driven down global solar prices.
That scale shows in generation too. According to IRENASTAT, China generated 839,551 GWh of solar electricity in 2024, the latest year with complete generation data, against 274,610 GWh in the United States and 127,881 GWh in India.
The countries that generate the most solar electricity
Installed capacity is not the same as energy produced: that depends on sunshine and on how much output is used. In 2024 the world generated about 2,091 TWh of solar PV electricity, according to the sum of IRENA's country data, and China produced 40%:
| # | Country | Solar generation 2024 (GWh) |
|---|---|---|
| 1 | China | 839,551 |
| 2 | United States | 274,610 |
| 3 | India | 127,881 |
| 4 | Japan | 98,129 |
| 5 | Germany | 75,379 |
| 6 | Brazil | 70,671 |
| 7 | Spain | 53,800 |
| 8 | Australia | 48,597 |
| 9 | South Korea | 37,137 |
| 10 | Italy | 35,993 |
| 14 | Mexico | 24,120 |
| 16 | Chile | 18,929 |
Sunnier countries get more out of each panel. According to an Energía Futura calculation with IRENA data, each GW installed in Mexico produced about 2 TWh in 2024, and in Chile 1.7 TWh, against less than 0.9 TWh in Germany or the Netherlands. This is an approximation, because capacity installed during the year does not produce for the whole year.

Who grew the most in solar power in 2025
In percentage terms, among the top 20, the biggest jump was Saudi Arabia, which almost doubled its capacity (+93.2%, from 6.2 to 11.9 GW) and ended about 150 MW short of Chile. India grew 39%, the biggest increase among large markets, and China 35.5%. At the other end, Japan and Vietnam grew less than 4%, after years of massive installations.
| Country | GW added in 2025 | Growth |
|---|---|---|
| China | 314.2 GW | +35.5% |
| India | 37.9 GW | +39.0% |
| United States | 34.0 GW | +19.4% |
| Germany | 16.0 GW | +17.5% |
| Brazil | 11.6 GW | +21.8% |
| Spain | 9.0 GW | +25.2% |
| Saudi Arabia | 5.7 GW | +93.2% |
| Chile | 1.1 GW | +10.3% |
Solar power in Latin America: the regional ranking
Brazil is by far the Latin American leader, with 64.7 GW and sixth place worldwide, driven by rooftop distributed generation. Mexico (12.9 GW) and Chile (12.0 GW) are almost tied. Further behind come Argentina, Colombia, Peru and Uruguay.
| World rank | Country | Solar capacity 2025 (MW) | Solar generation 2024 (GWh) |
|---|---|---|---|
| 6 | Brazil | 64,690 | 70,671 |
| 18 | Mexico | 12,912 | 24,120 |
| 19 | Chile | 12,033 | 18,929 |
| 44 | Argentina | 2,592 | 4,413 |
| 52 | Colombia | 1,726 | 3,254 |
| 68 | Peru | 1,016 | 1,371 |
| 92 | Uruguay | 339 | 446 |
One striking figure: Mexico generates more solar electricity than Chile with similar capacity. A possible reason is that in Chile part of solar output is lost to curtailment: during sunny hours the system cannot consume or transport all the energy, and plants must cut generation.
Chile's place in the world solar power ranking
Chile ranks 19th in the world with 12,033 MW of solar, according to IRENA, and added 1,125 MW in 2025. Relative to its size it is a highly solarised country: with about 20 million people, it has around 600 solar watts per person, almost twice the United Kingdom's per capita figure, thanks to the irradiation of the Atacama Desert, one of the highest on the planet.
Chile's growth slowed compared with previous years because of transmission congestion and curtailment, and investment shifted towards hybrid solar-plus-battery projects. Batteries now make up most of the projects waiting to connect, as we explained in the 12,188 MW of projects awaiting connection.
IRENA's figures may differ from those of Chile's grid operator, the Coordinador Eléctrico Nacional, which counts only grid-connected capacity and uses other power criteria. The national detail, with the largest parks and their output, is in solar energy in Chile in numbers.
Solar is also growing on rooftops. If you want to know how much it costs to install panels on a house in Chile, see the home solar kit: what it includes and what it costs.
Methodology and source
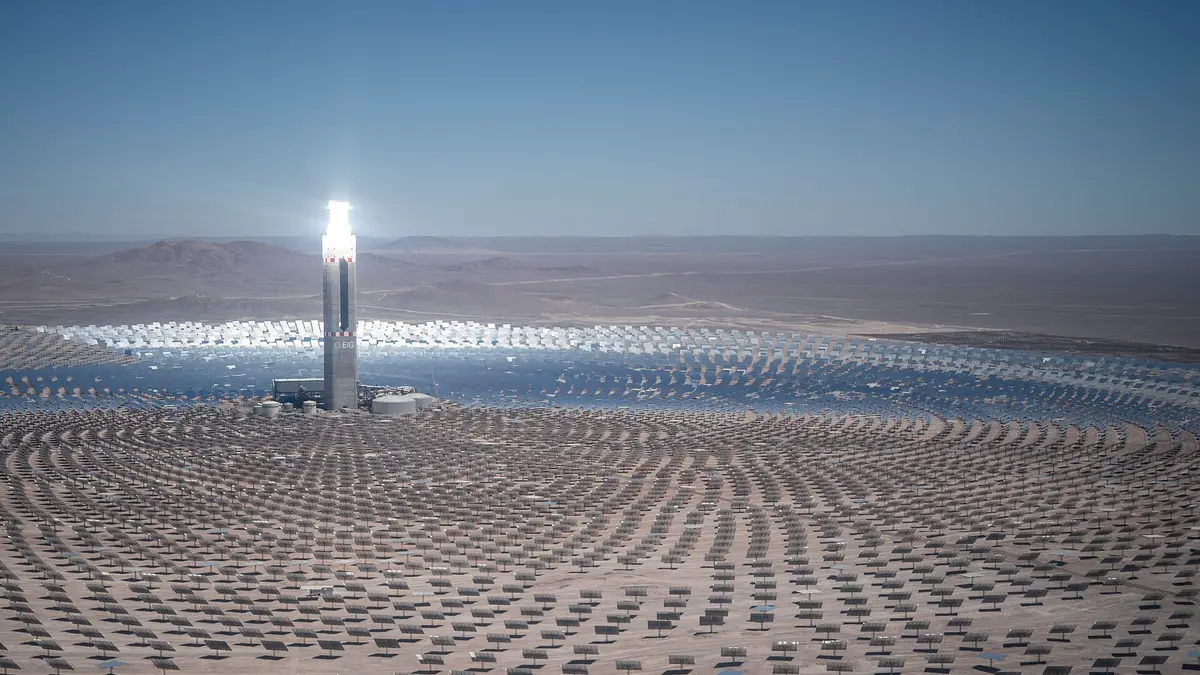
The data come from IRENASTAT's electricity statistics table by country (Electricity statistics by Country/area, Technology, Data Type, Grid connection and Year), with the “solar photovoltaic” technology, all connections (on-grid and off-grid) and the years 2024 and 2025, downloaded on October 18, 2026. Capacity is expressed in megawatts as reported by each country to IRENA. Growth and share percentages are Energía Futura calculations. Concentrated solar power (CSP), such as Cerro Dominador in Chile, is not included.
The sum of country data (2,388 GW) may differ slightly from the world total IRENA reports in its publications, because the agency rounds and revises figures between versions. We always use the latest available version of the database and state it in this page's update date.
Does your company develop solar projects or sell panels in Chile? Reach Energía Futura readers.
See advertising optionsFrequently asked questions
Which country has the most solar power in the world?
China, with 1,200 GW of solar PV capacity at the end of 2025, half the world's total, according to IRENA.
Where does Chile rank in solar power?
19th in the world, with 12 GW, and third in Latin America after Brazil and Mexico.
How much solar power is installed worldwide?
About 2,388 GW of solar PV at the end of 2025, according to the sum of IRENA's country data. 511 GW were added in 2025.
Which Latin American country has the most solar power?
Brazil, with 64.7 GW, sixth in the world.
How often is this ranking updated?
IRENA publishes its capacity statistics every March and updates its database during the year. We will update this ranking on this same page with each new version.
How to cite this data
Energía Futura (2026). Countries with the most solar power 2026: world ranking. Based on IRENA, IRENASTAT (updated September 28, 2026). Available at https://energiafutura.cl/en/news/countries-with-the-most-solar-power-2026-world-ranking-installed-capacity-chile. The cover chart may be reproduced crediting Energía Futura and linking to this page.