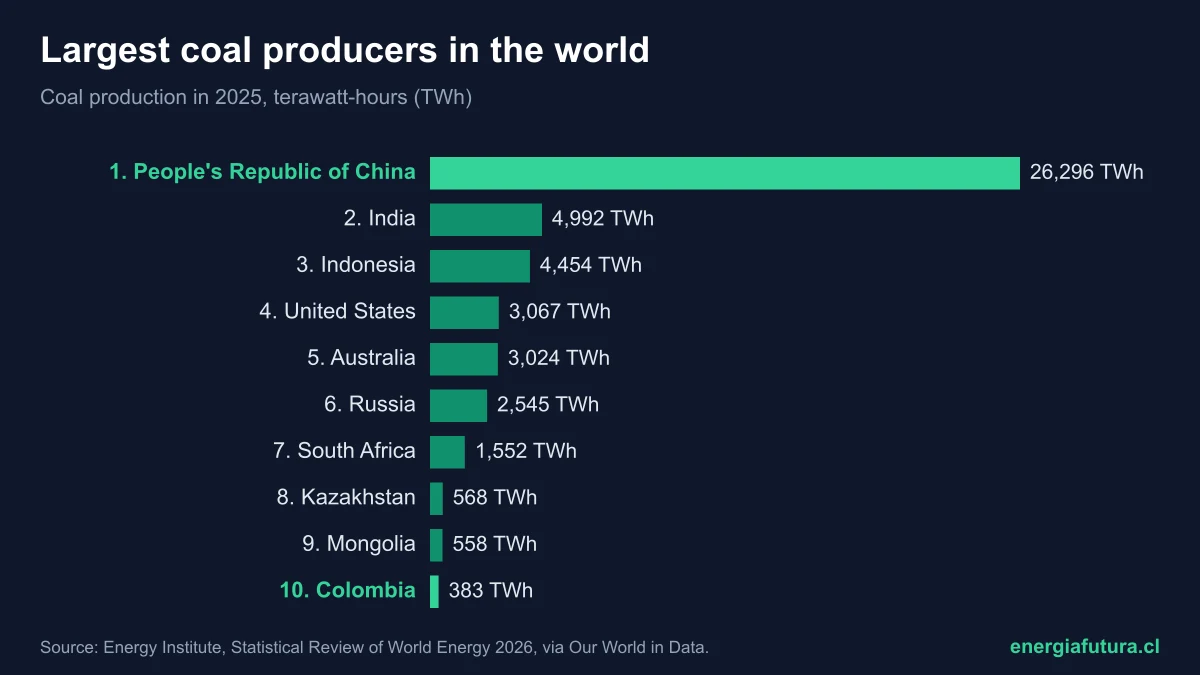
Updated on 18 November 2026. China is the world's largest coal producer and produces more than all other countries combined: 26,296 terawatt-hours (TWh) in 2025, 52.4% of the world total, according to the 2026 edition of the Energy Institute's Statistical Review of World Energy. It is followed by India (9.9%), Indonesia (8.9%), the United States (6.1%) and Australia (6%). Colombia, tenth, is the only Latin American country in the top 10.
World coal production was almost flat in 2025: 50,210 TWh, 0.1% less than in 2024 and 12.7% more than in 2015. This ranking orders countries by their 2025 output using Energy Institute data processed by Our World in Data, which expresses coal in energy terms (TWh) to compare coals of different quality.
View the data as a table
| China's share | 52.4% |
| World production | 50,210 TWh |
| US decline since 2000 | -52% |
| Colombia in the world ranking | N.º 10 |
Ranking of the largest coal producers in the world in 2025
| # | Country | 2025 production (TWh) | % of world | Change vs. 2024 | 2015 production (TWh) |
|---|---|---|---|---|---|
| 1 | China | 26,296 | 52.4% | +1.5% | 21,274 |
| 2 | India | 4,992 | 9.9% | 0.0% | 3,268 |
| 3 | Indonesia | 4,454 | 8.9% | −5.5% | 2,830 |
| 4 | United States | 3,067 | 6.1% | +4.1% | 4,997 |
| 5 | Australia | 3,024 | 6.0% | −7.0% | 3,556 |
| 6 | Russia | 2,545 | 5.1% | +0.5% | 2,167 |
| 7 | South Africa | 1,552 | 3.1% | −0.2% | 1,656 |
| 8 | Kazakhstan | 568 | 1.1% | +6.7% | 460 |
| 9 | Mongolia | 558 | 1.1% | −0.9% | 128 |
| 10 | Colombia | 383 | 0.8% | −16.6% | 693 |
| 11 | Poland | 373 | 0.7% | −4.0% | 616 |
| 12 | Canada | 303 | 0.6% | −4.9% | 376 |
| 13 | Vietnam | 297 | 0.6% | +4.1% | 271 |
| 14 | Germany | 213 | 0.4% | −7.0% | 498 |
| 15 | Turkey | 180 | 0.4% | −7.2% | 149 |
Source: Energy Institute, Statistical Review of World Energy 2026, via Our World in Data (production in TWh, 2025 and 2015 data). As a reference, 1 exajoule equals 277.8 TWh: China produced about 94.7 exajoules.
View the data as a table
| TWh | |
|---|---|
| People's Republic of China | 26,296 TWh |
| India | 4,992 TWh |
| Indonesia | 4,454 TWh |
| United States | 3,067 TWh |
| Australia | 3,024 TWh |
| Russia | 2,545 TWh |
| South Africa | 1,552 TWh |
| Kazakhstan | 568 TWh |
| Mongolia | 558 TWh |
| Colombia | 383 TWh |
| Poland | 373 TWh |
| Canada | 303 TWh |
| Vietnam | 297 TWh |
| Germany | 213 TWh |
| Türkiye | 180 TWh |
| Czech Republic | 97 TWh |
| Pakistan | 95 TWh |
| Ukraine | 73 TWh |
| Serbia | 67 TWh |
| Zimbabwe | 54 TWh |
| Thailand | 36 TWh |
| Bulgaria | 34 TWh |
| Uzbekistan | 33 TWh |
| Brazil | 32 TWh |
| Romania | 22 TWh |
| New Zealand | 18 TWh |
| Venezuela | 12 TWh |
| Greece | 8 TWh |
| Mexico | 4 TWh |
| Hungary | 4 TWh |
| Japan | 3 TWh |
| South Korea | 2 TWh |
| United Kingdom | 1 TWh |
| 1 | China | 26,296 | 52.4% | 1.5% |
| 2 | India | 4,992 | 9.9% | 0.0% |
| 3 | Indonesia | 4,454 | 8.9% | -5.5% |
| 4 | United States | 3,067 | 6.1% | 4.1% |
| 5 | Australia | 3,024 | 6.0% | -7.0% |
| 6 | Russia | 2,545 | 5.1% | 0.5% |
| 7 | South Africa | 1,552 | 3.1% | -0.2% |
| 8 | Kazakhstan | 568 | 1.1% | 6.7% |
| 9 | Mongolia | 558 | 1.1% | -0.9% |
| 10 | Colombia | 383 | 0.8% | -16.6% |
| 11 | Poland | 373 | 0.7% | -4.0% |
| 12 | Canada | 303 | 0.6% | -4.9% |
| 13 | Vietnam | 297 | 0.6% | 4.1% |
| 14 | Germany | 213 | 0.4% | -7.0% |
| 15 | Turkey | 180 | 0.4% | -7.2% |
| 16 | Czechia | 97 | 0.2% | 1.7% |
| 17 | Pakistan | 95 | 0.2% | 1.2% |
| 18 | Ukraine | 73 | 0.1% | -31.0% |
| 19 | Serbia | 67 | 0.1% | 6.6% |
| 20 | Zimbabwe | 54 | 0.1% | 23.2% |
| 21 | Thailand | 36 | 0.1% | -2.3% |
| 22 | Bulgaria | 34 | 0.1% | 14.6% |
| 23 | Uzbekistan | 33 | 0.1% | 8.5% |
| 24 | Brazil | 32 | 0.1% | 8.8% |
| 25 | Romania | 22 | 0.0% | -2.8% |
| 26 | New Zealand | 18 | 0.0% | 4.2% |
| 27 | Venezuela | 12 | 0.0% | 160.0% |
| 28 | Greece | 8 | 0.0% | -16.1% |
| 29 | Mexico | 4 | 0.0% | 0.7% |
| 30 | Hungary | 4 | 0.0% | -45.2% |
| 31 | Japan | 3 | 0.0% | -13.4% |
| 32 | South Korea | 2 | 0.0% | -22.7% |
| 33 | United Kingdom | 1 | 0.0% | 12.3% |
China, the largest coal producer: half the world
In 2000 China produced 8,226 TWh of coal, slightly more than the United States (6,330 TWh). In 2025 it produced 3.2 times that figure. Coal remains the backbone of its power system and its steel and cement industries, and the country kept increasing output in 2025 (+1.5%) despite also being the world's largest installer of solar and wind power. China also has the planet's largest coal plants, as shown in the ranking of the largest coal power plant in the world.
Behind China the order changed in the 21st century. India went from 1,771 to 4,992 TWh and has been second since 2020. Indonesia, which produced only 528 TWh in 2000, multiplied its output eightfold and is the world's largest thermal coal exporter, although it fell 5.5% in 2025. Mongolia, ninth, has more than quadrupled its output since 2015 to sell to China.
View the data as a table
| 2000 | 2001 | 2002 | 2003 | 2004 | 2005 | 2006 | 2007 | 2008 | 2009 | 2010 | 2011 | 2012 | 2013 | 2014 | 2015 | 2016 | 2017 | 2018 | 2019 | 2020 | 2021 | 2022 | 2023 | 2024 | 2025 | |
|---|---|---|---|---|---|---|---|---|---|---|---|---|---|---|---|---|---|---|---|---|---|---|---|---|---|---|
| China | 8,226 TWh | 8,715 TWh | 9,307 TWh | 10,994 TWh | 12,874 TWh | 14,441 TWh | 15,450 TWh | 16,739 TWh | 17,349 TWh | 17,885 TWh | 19,367 TWh | 21,535 TWh | 21,789 TWh | 22,034 TWh | 21,681 TWh | 21,274 TWh | 19,671 TWh | 20,326 TWh | 21,353 TWh | 21,771 TWh | 21,988 TWh | 22,826 TWh | 25,016 TWh | 25,609 TWh | 25,916 TWh | 26,296 TWh |
| India | 1,771 TWh | 1,794 TWh | 1,873 TWh | 1,955 TWh | 2,111 TWh | 2,207 TWh | 2,304 TWh | 2,447 TWh | 2,648 TWh | 2,858 TWh | 2,937 TWh | 2,915 TWh | 2,966 TWh | 2,974 TWh | 3,134 TWh | 3,268 TWh | 3,302 TWh | 3,330 TWh | 3,555 TWh | 3,499 TWh | 3,497 TWh | 3,717 TWh | 4,180 TWh | 4,674 TWh | 4,990 TWh | 4,992 TWh |
| Indonesia | 528 TWh | 634 TWh | 708 TWh | 783 TWh | 907 TWh | 1,048 TWh | 1,308 TWh | 1,473 TWh | 1,645 TWh | 1,722 TWh | 1,760 TWh | 2,204 TWh | 2,377 TWh | 2,901 TWh | 2,821 TWh | 2,830 TWh | 2,742 TWh | 2,691 TWh | 3,178 TWh | 3,567 TWh | 3,271 TWh | 3,522 TWh | 3,876 TWh | 4,371 TWh | 4,714 TWh | 4,454 TWh |
| United States | 6,330 TWh | 6,556 TWh | 6,329 TWh | 6,151 TWh | 6,362 TWh | 6,455 TWh | 6,623 TWh | 6,541 TWh | 6,641 TWh | 6,020 TWh | 6,136 TWh | 6,187 TWh | 5,757 TWh | 5,569 TWh | 5,648 TWh | 4,997 TWh | 4,084 TWh | 4,350 TWh | 4,277 TWh | 3,969 TWh | 2,980 TWh | 3,229 TWh | 3,353 TWh | 3,272 TWh | 2,945 TWh | 3,067 TWh |
| Australia | 1,997 TWh | 2,158 TWh | 2,224 TWh | 2,299 TWh | 2,389 TWh | 2,501 TWh | 2,557 TWh | 2,641 TWh | 2,721 TWh | 2,823 TWh | 2,915 TWh | 2,851 TWh | 3,092 TWh | 3,324 TWh | 3,559 TWh | 3,556 TWh | 3,563 TWh | 3,473 TWh | 3,717 TWh | 3,804 TWh | 3,494 TWh | 3,407 TWh | 3,180 TWh | 3,189 TWh | 3,252 TWh | 3,024 TWh |
| Russia | 1,413 TWh | 1,494 TWh | 1,425 TWh | 1,541 TWh | 1,595 TWh | 1,577 TWh | 1,640 TWh | 1,669 TWh | 1,732 TWh | 1,649 TWh | 1,755 TWh | 1,833 TWh | 1,957 TWh | 2,013 TWh | 2,054 TWh | 2,167 TWh | 2,256 TWh | 2,393 TWh | 2,563 TWh | 2,564 TWh | 2,336 TWh | 2,564 TWh | 2,593 TWh | 2,554 TWh | 2,533 TWh | 2,545 TWh |
| South Africa | 1,473 TWh | 1,369 TWh | 1,354 TWh | 1,462 TWh | 1,496 TWh | 1,609 TWh | 1,608 TWh | 1,628 TWh | 1,661 TWh | 1,643 TWh | 1,694 TWh | 1,652 TWh | 1,707 TWh | 1,691 TWh | 1,722 TWh | 1,656 TWh | 1,677 TWh | 1,659 TWh | 1,693 TWh | 1,699 TWh | 1,614 TWh | 1,539 TWh | 1,515 TWh | 1,539 TWh | 1,555 TWh | 1,552 TWh |
| Kazakhstan | 377 TWh | 398 TWh | 370 TWh | 425 TWh | 436 TWh | 433 TWh | 482 TWh | 491 TWh | 558 TWh | 505 TWh | 552 TWh | 579 TWh | 600 TWh | 598 TWh | 581 TWh | 460 TWh | 487 TWh | 534 TWh | 549 TWh | 522 TWh | 515 TWh | 533 TWh | 541 TWh | 558 TWh | 533 TWh | 568 TWh |
| Mongolia | 27 TWh | 27 TWh | 29 TWh | 30 TWh | 36 TWh | 40 TWh | 43 TWh | 49 TWh | 53 TWh | 76 TWh | 133 TWh | 175 TWh | 165 TWh | 176 TWh | 129 TWh | 128 TWh | 186 TWh | 262 TWh | 289 TWh | 302 TWh | 228 TWh | 171 TWh | 208 TWh | 440 TWh | 564 TWh | 558 TWh |
| Colombia | 307 TWh | 352 TWh | 317 TWh | 401 TWh | 432 TWh | 479 TWh | 529 TWh | 558 TWh | 587 TWh | 582 TWh | 594 TWh | 685 TWh | 711 TWh | 683 TWh | 708 TWh | 693 TWh | 731 TWh | 733 TWh | 702 TWh | 707 TWh | 454 TWh | 509 TWh | 535 TWh | 553 TWh | 459 TWh | 383 TWh |
| Poland | 836 TWh | 838 TWh | 835 TWh | 831 TWh | 806 TWh | 807 TWh | 791 TWh | 727 TWh | 708 TWh | 656 TWh | 644 TWh | 648 TWh | 672 TWh | 665 TWh | 628 TWh | 616 TWh | 606 TWh | 579 TWh | 550 TWh | 519 TWh | 468 TWh | 489 TWh | 475 TWh | 413 TWh | 389 TWh | 373 TWh |
| Canada | 455 TWh | 463 TWh | 398 TWh | 370 TWh | 394 TWh | 418 TWh | 408 TWh | 419 TWh | 420 TWh | 391 TWh | 415 TWh | 414 TWh | 417 TWh | 419 TWh | 417 TWh | 376 TWh | 381 TWh | 370 TWh | 340 TWh | 335 TWh | 318 TWh | 336 TWh | 338 TWh | 352 TWh | 318 TWh | 303 TWh |
View the data as a table
| India | Indonesia | United States | Australia | Russia | |
|---|---|---|---|---|---|
| 2000 | 1,771 | 528 | 6,330 | 1,997 | 1,413 |
| 2001 | 1,794 | 634 | 6,556 | 2,158 | 1,494 |
| 2002 | 1,873 | 708 | 6,329 | 2,224 | 1,425 |
| 2003 | 1,955 | 783 | 6,151 | 2,299 | 1,541 |
| 2004 | 2,111 | 907 | 6,362 | 2,389 | 1,595 |
| 2005 | 2,207 | 1,048 | 6,455 | 2,501 | 1,577 |
| 2006 | 2,304 | 1,308 | 6,623 | 2,557 | 1,640 |
| 2007 | 2,447 | 1,473 | 6,541 | 2,641 | 1,669 |
| 2008 | 2,648 | 1,645 | 6,641 | 2,721 | 1,732 |
| 2009 | 2,858 | 1,722 | 6,020 | 2,823 | 1,649 |
| 2010 | 2,937 | 1,760 | 6,136 | 2,915 | 1,755 |
| 2011 | 2,915 | 2,204 | 6,187 | 2,851 | 1,833 |
| 2012 | 2,966 | 2,377 | 5,757 | 3,092 | 1,957 |
| 2013 | 2,974 | 2,901 | 5,569 | 3,324 | 2,013 |
| 2014 | 3,134 | 2,821 | 5,648 | 3,559 | 2,054 |
| 2015 | 3,268 | 2,830 | 4,997 | 3,556 | 2,167 |
| 2016 | 3,302 | 2,742 | 4,084 | 3,563 | 2,256 |
| 2017 | 3,330 | 2,691 | 4,350 | 3,473 | 2,393 |
| 2018 | 3,555 | 3,178 | 4,277 | 3,717 | 2,563 |
| 2019 | 3,499 | 3,567 | 3,969 | 3,804 | 2,564 |
| 2020 | 3,497 | 3,271 | 2,980 | 3,494 | 2,336 |
| 2021 | 3,717 | 3,522 | 3,229 | 3,407 | 2,564 |
| 2022 | 4,180 | 3,876 | 3,353 | 3,180 | 2,593 |
| 2023 | 4,674 | 4,371 | 3,272 | 3,189 | 2,554 |
| 2024 | 4,990 | 4,714 | 2,945 | 3,252 | 2,533 |
| 2025 | 4,992 | 4,454 | 3,067 | 3,024 | 2,545 |
Two types of coal are measured together in this ranking: thermal coal, burned in power plants and industry, and metallurgical or coking coal, used to make steel. Australia, fifth, is the largest exporter of metallurgical coal and sells mainly to Japan, South Korea, India and China; its output fell 7% in 2025. Russia, sixth, redirected its exports to Asia after the European sanctions of 2022, and South Africa, seventh, relies on coal for around four-fifths of its electricity and exports through the port of Richards Bay.
In rich countries coal is in retreat. The United States produces 52% less than in 2000, although output rose 4.1% in 2025. Germany fell from 706 to 213 TWh and Poland from 836 to 373 TWh. OECD countries produced 7,718 TWh in 2025, 33% less than in 2015.

Coal production by region
Asia Pacific accounts for 80.1% of world coal production, with 40,203 TWh, and has grown 27% since 2015. No other region exceeds 7%: North America produces 6.7% and fell 38% in ten years; the CIS (Russia and its neighbours), 6.4%; and Africa, mainly South Africa, 3.6%. Europe produced 1,167 TWh, 47% less than in 2015, and South and Central America just 429 TWh, 43.5% less.
| Region | 2025 production (TWh) | % of world | Change vs. 2024 | 2015 production (TWh) |
|---|---|---|---|---|
| Asia Pacific | 40,203 | 80.1% | −0.2% | 31,743 |
| North America | 3,374 | 6.7% | +3.2% | 5,452 |
| CIS (Russia and neighbours) | 3,191 | 6.4% | +1.7% | 2,657 |
| Africa | 1,823 | 3.6% | +1.8% | 1,758 |
| Europe | 1,167 | 2.3% | −6.5% | 2,188 |
| South and Central America | 429 | 0.9% | −13.4% | 760 |
| Middle East | 22 | 0.04% | +3.3% | 9 |
| World | 50,210 | 100% | −0.1% | 44,568 |
Source: Energy Institute, Statistical Review of World Energy 2026, via Our World in Data. Regions are those of the Energy Institute.
Colombia, Latin America's only large coal producer
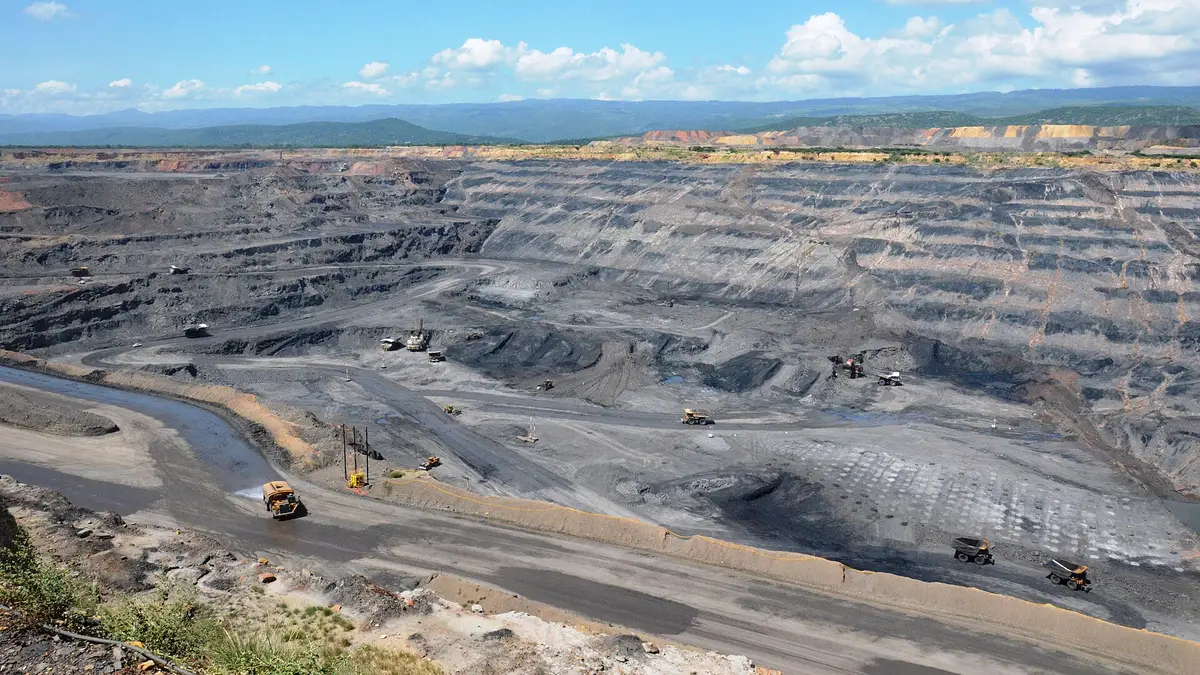
Colombia is Latin America's largest coal producer and 10th in the world, with 383 TWh in 2025. But its output fell 16.6% in the year and is 45% lower than in 2015 (693 TWh). According to Portafolio, Colombian production fell in 2025 to 53.9 million tonnes, its lowest level in two decades, while Indonesia and Australia gain market share. Most of it comes from the open-pit mines of La Guajira and Cesar, such as Cerrejón.
The rest of the region produces very little: Brazil (32 TWh, 24th), Venezuela (12 TWh) and Mexico (4 TWh). Chile has practically stopped producing coal: after the closure of the Invierno mine in Magallanes, its output was just 122 teracalories in 2024, according to the National Energy Balance cited by the Uno Punto Cinco Foundation in its report Estado de los Combustibles Fósiles en Chile.
Does your company work in decarbonisation, renewables or storage? Reach Energía Futura's readers.
See advertising optionsThe coal Chile uses and the retirement of its plants
Chile imports almost all the coal it burns in its thermal power plants. According to the Uno Punto Cinco Foundation report, coal imports grew until 2021 and then fell sharply, returning in 2024 to levels similar to those of 2000, in line with plant closures. Colombia is among the country's coal suppliers. How much electricity each country still generates from coal is in the ranking of countries that generate the most electricity from coal.
Worldwide, coal remains the largest source of fossil CO2 emissions. The Global Carbon Project estimated that fossil emissions would fall 0.4% in 2026, as we reported in the story on the Global Carbon Budget 2026. Coal production stalling in 2025 is a sign in that direction, but the world still produces 12.7% more than ten years ago.
Methodology
2025 production in TWh is as published by Our World in Data using data from the Energy Institute's Statistical Review of World Energy 2026 and other sources. It includes thermal and metallurgical coal and lignite, converted to their energy content, so it is not equivalent to tonnes: a tonne of lignite contains much less energy than a tonne of bituminous coal. Regional aggregates are excluded from the country ranking; regional totals are those of the Energy Institute. Data downloaded on 18 November 2026.
How to cite this data
Energía Futura (2026). “Largest coal producing countries in the world 2026: ranking and Latin America”. Updated on 18 November 2026. energiafutura.cl/en/news/largest-coal-producing-countries-in-the-world-2026-ranking-and-latin-america. Data: Energy Institute (2026), Statistical Review of World Energy.
Frequently asked questions
Which country is the largest coal producer in the world?
China, with 26,296 TWh in 2025, 52.4% of world production, according to the Energy Institute.
What are the top 5 coal producers?
China, India, Indonesia, the United States and Australia, in that order, in 2025.
Which is the largest coal producer in Latin America?
Colombia, tenth in the world, with 383 TWh in 2025, although its output fell 16.6%.
Does Chile produce coal?
Practically not: it produced 122 teracalories in 2024. The coal its plants use is imported.
Is world coal production falling?
It has stalled: it fell 0.1% in 2025, but remains 12.7% above 2015 because Asia offsets the decline in Europe and North America.
How much coal does India produce?
4,992 TWh in 2025, 9.9% of the world, almost the same as in 2024. It has been the second-largest producer since 2020 and has almost tripled its output since 2000.
Which region of the world produces the most coal?
Asia Pacific, with 80.1% of world production in 2025, thanks to China, India, Indonesia and Australia.
Which country increased its coal output most in 2025?
Among the large producers, Kazakhstan (+6.7%), the United States (+4.1%), Vietnam (+4.1%) and China (+1.5%).