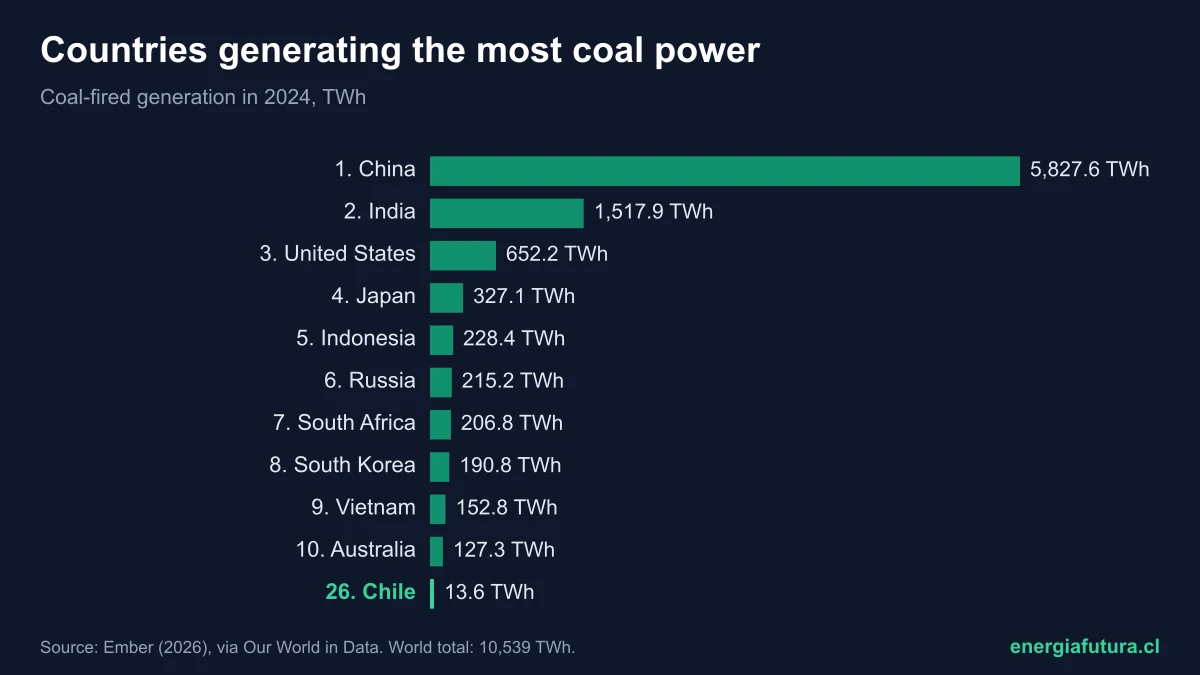
Updated on 11 November 2026. China is the country that generates the most electricity from coal: 5,828 TWh in 2024, 55.3% of all the world's coal power, according to Ember data processed by Our World in Data. It is followed by India, with 1,518 TWh, and the United States, with 652 TWh: together the three account for 75.9%. Chile ranks 26th of 80 countries with coal generation, with 13.6 TWh, 15.3% of its electricity.
The world generated 10,539 TWh from coal in 2024, a record, and 34.1% of all its electricity. Preliminary 2025 data show the first decline since 2020: 10,472 TWh (−0.6%) and a share of 33.0%, the lowest in the series. This data sheet brings together the country ranking, the map, the situation in Latin America and trends since 2000, in the week COP31 discusses how to keep reducing fossil fuels.
Ranking of the countries that generate the most electricity from coal
The table ranks countries by coal-fired generation in 2024, the last year with complete data for all of them. The fourth column shows what share of each country's electricity comes from coal, and the last one, the preliminary 2025 figure where available.
| Rank | Country | TWh 2024 | % of its electricity | TWh 2025 (preliminary) |
|---|---|---|---|---|
| 1 | China | 5,827.6 | 57.8% | 5,751.6 |
| 2 | India | 1,517.9 | 74.5% | 1,474.2 |
| 3 | United States | 652.2 | 14.9% | 737.2 |
| 4 | Japan | 327.1 | 32.2% | 330.1 |
| 5 | Indonesia | 228.4 | 61.5% | No data |
| 6 | Russia | 215.2 | 17.8% | 219.5 |
| 7 | South Africa | 206.8 | 83.6% | 197.5 |
| 8 | South Korea | 190.8 | 30.5% | 194.5 |
| 9 | Vietnam | 152.8 | 50.3% | 149.2 |
| 10 | Australia | 127.3 | 45.2% | 122.4 |
| 11 | Turkey | 121.3 | 35.6% | 121.4 |
| 12 | Taiwan | 115.6 | 40.1% | 104.6 |
| 13 | Germany | 106.3 | 21.4% | 103.2 |
| 14 | Poland | 93.5 | 54.3% | 87.3 |
| 15 | Malaysia | 85.3 | 43.1% | 89.6 |
| 26 | Chile | 13.6 | 15.3% | 15.7 |
Source: Ember (2026), Yearly Electricity Data, via Our World in Data (2026 update). Share of the world total calculated by Energía Futura. 2025 data are preliminary and do not cover all countries.
Concentration is extreme. China generates more electricity from coal than the next 79 countries combined. India depends on it even more: 74.5% of its electricity comes from coal, and its generation rose from 1,007 TWh in 2015 to 1,518 TWh in 2024. The United States is going the other way: in 2007 it generated 2,016 TWh from coal and in 2024, 652 TWh, less than a third, although it rebounded 13% in 2025.
View the data as a table
| Botswana | 98.3% · 3.4 TWh |
| Mongolia | 84.7% · 7.5 TWh |
| South Africa | 83.6% · 206.8 TWh |
| India | 74.5% · 1517.9 TWh |
| Philippines | 63.9% · 79.4 TWh |
| Serbia | 62.9% · 23.3 TWh |
| Morocco | 61.7% · 26.2 TWh |
| Indonesia | 61.5% · 228.4 TWh |
| Cambodia | 60.9% · 9.4 TWh |
| Bosnia and Herzegovina | 58.7% · 9.1 TWh |
| People's Republic of China | 57.8% · 5827.6 TWh |
| Poland | 54.3% · 93.5 TWh |
| Kazakhstan | 54.0% · 64.0 TWh |
| Vietnam | 50.3% · 152.8 TWh |
| Australia | 45.2% · 127.3 TWh |
| Malaysia | 43.1% · 85.3 TWh |
| Zimbabwe | 42.9% · 4.4 TWh |
| Montenegro | 40.5% · 1.4 TWh |
| Taiwan | 40.1% · 115.6 TWh |
| Mauritius | 39.3% · 1.3 TWh |
| The Republic of North Macedonia | 37.4% · 2.4 TWh |
| New Caledonia | 36.5% · 1.1 TWh |
| Czech Republic | 36.4% · 26.5 TWh |
| Türkiye | 35.6% · 121.3 TWh |
| North Korea | 34.1% · 9.2 TWh |
| Hong Kong | 33.7% · 12.6 TWh |
| Sri Lanka | 32.9% · 5.6 TWh |
| Japan | 32.2% · 327.1 TWh |
| South Korea | 30.5% · 190.8 TWh |
| Dominican Republic | 30.0% · 7.2 TWh |
| Lao People's Democratic Republic | 23.3% · 12.2 TWh |
| Bulgaria | 22.9% · 8.8 TWh |
| Germany | 21.4% · 106.3 TWh |
| Slovenia | 20.9% · 3.5 TWh |
| Madagascar | 20.6% · 0.5 TWh |
| Bangladesh | 19.9% · 20.3 TWh |
| Brunei Darussalam | 19.8% · 1.1 TWh |
| Niger | 17.9% · 0.2 TWh |
| Russia | 17.8% · 215.2 TWh |
| Thailand | 16.7% · 33.3 TWh |
| Puerto Rico | 16.0% · 3.2 TWh |
| Guatemala | 15.8% · 2.5 TWh |
| Chile | 15.3% · 13.6 TWh |
| Rwanda | 15.0% · 0.2 TWh |
| United States | 14.9% · 652.2 TWh |
| Israel | 14.3% · 11.5 TWh |
| Pakistan | 13.9% · 24.4 TWh |
| Romania | 13.4% · 7.1 TWh |
| Colombia | 12.6% · 11.2 TWh |
| Zambia | 10.8% · 2.1 TWh |
| Kyrgyzstan | 9.7% · 1.5 TWh |
| Uzbekistan | 7.0% · 5.7 TWh |
| Hungary | 6.4% · 2.4 TWh |
| Netherlands | 6.1% · 7.5 TWh |
| Greece | 5.7% · 3.3 TWh |
| Myanmar | 5.5% · 1.2 TWh |
| Croatia | 5.2% · 0.8 TWh |
| Denmark | 5.0% · 1.8 TWh |
| Tajikistan | 4.5% · 1.0 TWh |
| Canada | 3.9% · 25.1 TWh |
| Panama | 3.7% · 0.5 TWh |
| Mexico | 3.5% · 12.4 TWh |
| Eswatini | 3.3% · 0.0 TWh |
| Afghanistan | 3.0% · 0.0 TWh |
| New Zealand | 2.7% · 1.2 TWh |
| Namibia | 2.4% · 0.0 TWh |
| Brazil | 2.2% · 16.2 TWh |
| Ireland | 2.0% · 0.6 TWh |
| Slovakia | 1.8% · 0.5 TWh |
| Italy | 1.5% · 4.0 TWh |
| Senegal | 1.3% · 0.1 TWh |
| Finland | 1.0% · 0.8 TWh |
| Singapore | 1.0% · 0.6 TWh |
| Spain | 0.9% · 2.6 TWh |
| Argentina | 0.9% · 1.3 TWh |
| United Kingdom | 0.7% · 1.9 TWh |
| Honduras | 0.5% · 0.1 TWh |
| France | 0.2% · 1.0 TWh |
| Iran | 0.2% · 0.7 TWh |
| Belarus | 0.0% · 0.0 TWh |
The countries most dependent on coal
Measured as a share, the ranking changes. Botswana generates 98.3% of its electricity from coal, followed by Mongolia (84.7%), South Africa (83.6%) and India (74.5%). The top ten is completed by the Philippines (63.9%), Serbia (62.9%), Morocco (61.7%), Indonesia (61.5%), Cambodia (60.9%) and Bosnia and Herzegovina (58.7%). In total, 14 countries generate half or more of their electricity from coal.
At the other end, several European countries almost eliminated it: the United Kingdom closed its last coal plant in 2024, and France, Spain and Italy generate less than 2% from this fuel. The transition was not always towards renewables: in France the replacement is nuclear and in the United States it was largely natural gas. The countries that advanced most with clean energy appear in our ranking of countries with the most renewable electricity.
How coal power has changed since 2000
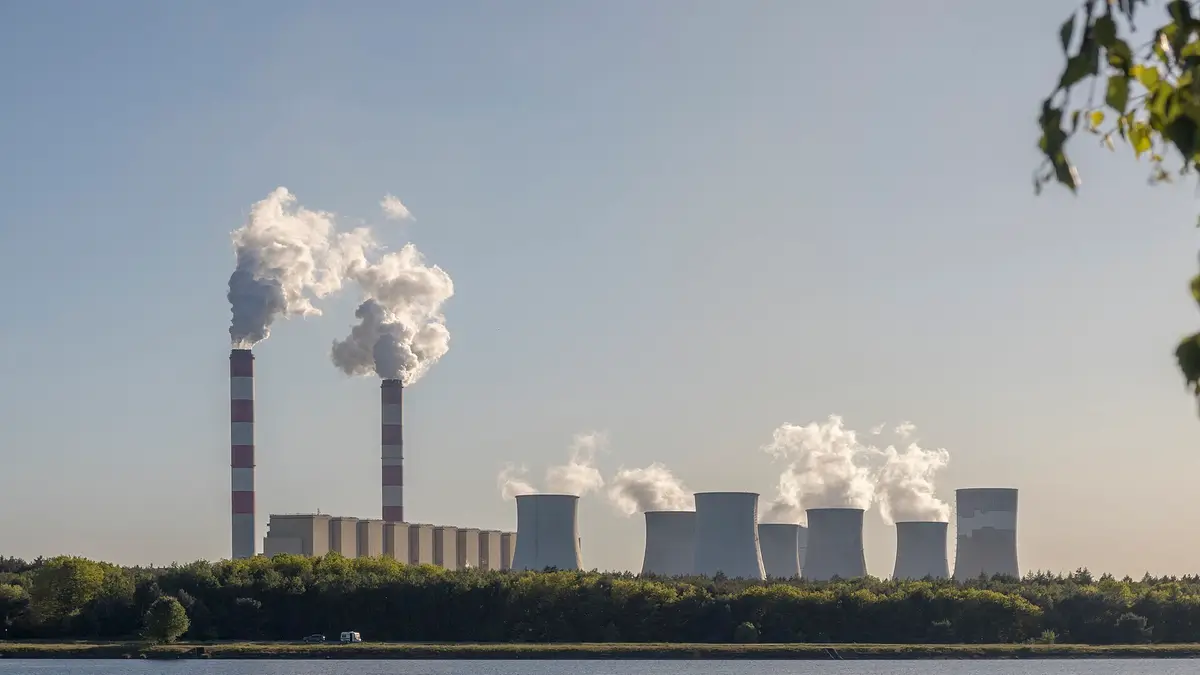
In 2000, the world generated 5,809 TWh from coal, 38.0% of its electricity. In 2024 it was 10,539 TWh: almost double. But coal's share peaked in 2007, at 40.8%, and has been falling since: renewables, gas and nuclear grew faster. In other words, coal is losing weight even though its total use has not yet fallen sharply.
View the data as a table
| World | China | India | United States | Chile | |
|---|---|---|---|---|---|
| 2000 | 38.0% | 78.2% | 68.3% | 51.7% | 20.6% |
| 2001 | 38.0% | 76.3% | 69.7% | 51.1% | 11.4% |
| 2002 | 38.3% | 77.5% | 70.0% | 50.3% | 11.6% |
| 2003 | 39.5% | 79.6% | 69.2% | 51.0% | 10.5% |
| 2004 | 39.0% | 78.2% | 66.3% | 50.1% | 15.1% |
| 2005 | 39.5% | 79.2% | 67.9% | 49.9% | 13.8% |
| 2006 | 40.2% | 80.3% | 67.9% | 49.2% | 19.3% |
| 2007 | 40.8% | 81.0% | 67.0% | 48.7% | 22.8% |
| 2008 | 40.2% | 77.5% | 69.2% | 48.3% | 23.7% |
| 2009 | 39.9% | 78.4% | 69.6% | 44.6% | 24.7% |
| 2010 | 39.8% | 76.9% | 68.7% | 44.9% | 28.0% |
| 2011 | 40.6% | 78.3% | 67.9% | 42.4% | 29.9% |
| 2012 | 39.8% | 75.2% | 72.3% | 37.5% | 36.4% |
| 2013 | 40.7% | 75.1% | 74.3% | 39.0% | 41.5% |
| 2014 | 40.4% | 72.5% | 75.5% | 38.6% | 37.1% |
| 2015 | 38.7% | 69.6% | 76.8% | 33.1% | 37.4% |
| 2016 | 37.8% | 67.8% | 77.0% | 30.3% | 38.4% |
| 2017 | 38.0% | 67.1% | 76.3% | 29.8% | 37.1% |
| 2018 | 37.9% | 66.5% | 76.3% | 27.4% | 36.6% |
| 2019 | 36.6% | 64.7% | 74.9% | 23.2% | 33.5% |
| 2020 | 35.3% | 63.3% | 73.2% | 19.1% | 31.2% |
| 2021 | 35.9% | 62.5% | 74.8% | 21.6% | 29.6% |
| 2022 | 35.4% | 61.2% | 74.5% | 19.4% | 23.6% |
| 2023 | 35.0% | 60.8% | 75.4% | 15.9% | 16.3% |
| 2024 | 34.1% | 57.8% | 74.5% | 14.9% | 15.3% |
| 2025 | 33.0% | 54.3% | 70.8% | 16.3% | 17.8% |
The change at the top shows in the race: in 2000, the United States generated almost twice as much coal power as China (1,966 versus 1,060 TWh). China overtook it in 2006 and now generates almost nine times more. India passed the United States in 2018 and became the world's second.
View the data as a table
| 2000 | 2001 | 2002 | 2003 | 2004 | 2005 | 2006 | 2007 | 2008 | 2009 | 2010 | 2011 | 2012 | 2013 | 2014 | 2015 | 2016 | 2017 | 2018 | 2019 | 2020 | 2021 | 2022 | 2023 | 2024 | |
|---|---|---|---|---|---|---|---|---|---|---|---|---|---|---|---|---|---|---|---|---|---|---|---|---|---|
| United States | 1,966 | 1,904 | 1,933 | 1,974 | 1,978 | 2,013 | 1,991 | 2,016 | 1,986 | 1,756 | 1,847 | 1,733 | 1,514 | 1,581 | 1,582 | 1,352 | 1,239 | 1,206 | 1,149 | 965 | 773 | 898 | 832 | 675 | 652 |
| China | 1,060 | 1,129 | 1,283 | 1,520 | 1,722 | 1,980 | 2,302 | 2,657 | 2,709 | 2,912 | 3,234 | 3,691 | 3,748 | 4,077 | 4,203 | 4,046 | 4,156 | 4,430 | 4,764 | 4,855 | 4,922 | 5,334 | 5,415 | 5,753 | 5,828 |
| India | 390 | 408 | 427 | 441 | 463 | 478 | 505 | 533 | 573 | 611 | 643 | 701 | 787 | 848 | 950 | 1,007 | 1,074 | 1,115 | 1,199 | 1,199 | 1,144 | 1,256 | 1,344 | 1,445 | 1,518 |
| Germany | 297 | 294 | 300 | 305 | 299 | 288 | 289 | 297 | 275 | 253 | 263 | 262 | 276 | 288 | 274 | 272 | 262 | 241 | 228 | 171 | 135 | 165 | 180 | 125 | 106 |
| Japan | 238 | 254 | 264 | 292 | 295 | 319 | 311 | 317 | 334 | 312 | 317 | 285 | 334 | 363 | 356 | 350 | 339 | 363 | 361 | 351 | 340 | 348 | 351 | 327 | 327 |
| South Africa | 196 | 197 | 206 | 220 | 230 | 232 | 240 | 248 | 243 | 235 | 243 | 244 | 240 | 233 | 230 | 227 | 230 | 229 | 231 | 225 | 214 | 211 | 202 | 192 | 207 |
| Australia | 180 | 180 | 172 | 174 | 179 | 183 | 186 | 185 | 184 | 182 | 176 | 172 | 165 | 155 | 155 | 162 | 162 | 159 | 157 | 150 | 143 | 137 | 129 | 126 | 127 |
| Russia | 176 | 169 | 170 | 172 | 161 | 166 | 178 | 171 | 197 | 164 | 166 | 165 | 169 | 162 | 159 | 159 | 171 | 174 | 177 | 188 | 175 | 187 | 192 | 204 | 215 |
| Poland | 136 | 135 | 133 | 141 | 141 | 142 | 147 | 144 | 139 | 133 | 137 | 140 | 135 | 138 | 130 | 131 | 130 | 131 | 131 | 118 | 107 | 128 | 125 | 99 | 94 |
| United Kingdom | 120 | 131 | 124 | 138 | 132 | 135 | 149 | 136 | 124 | 103 | 108 | 108 | 143 | 130 | 100 | 76 | 31 | 23 | 17 | 7 | 6 | 7 | 6 | 4 | 2 |
| South Korea | 115 | 127 | 137 | 139 | 143 | 150 | 154 | 171 | 191 | 209 | 218 | 225 | 223 | 224 | 226 | 233 | 233 | 261 | 258 | 245 | 208 | 213 | 209 | 201 | 191 |
| Indonesia | 34 | 38 | 43 | 46 | 48 | 52 | 59 | 64 | 61 | 66 | 68 | 81 | 102 | 111 | 120 | 125 | 135 | 148 | 160 | 174 | 181 | 190 | 205 | 217 | 228 |
| Vietnam | 3 | 3 | 5 | 7 | 7 | 11 | 12 | 12 | 12 | 12 | 16 | 20 | 21 | 24 | 35 | 56 | 68 | 68 | 92 | 120 | 123 | 118 | 104 | 130 | 153 |
Chile's place in coal power
Chile generated 13.6 TWh from coal in 2024, 15.3% of its electricity, ranking 26th in the world. It is fourth in Latin America by share, behind the Dominican Republic, Puerto Rico and Guatemala, and second by volume, behind Brazil. A decade earlier the story was different: in 2013, coal reached 41.5% of Chile's electricity, and in 2016 the country generated its maximum, 30.3 TWh.
| Year | Coal generation in Chile (TWh) | % of electricity |
|---|---|---|
| 2000 | 8.5 | 20.6% |
| 2005 | 7.2 | 13.8% |
| 2010 | 16.9 | 28.0% |
| 2013 | 30.2 | 41.5% (peak) |
| 2016 | 30.3 (peak) | 38.4% |
| 2020 | 26.1 | 31.2% |
| 2023 | 14.5 | 16.3% |
| 2024 | 13.6 | 15.3% |
| 2025 (preliminary) | 15.7 | 17.8% |
Source: Ember (2026), via Our World in Data. The decline since 2019 reflects the coal plant retirement and conversion plan agreed between the State and generators, and the growth of solar and wind. In 2025 coal rose to 15.7 TWh (+15.9%), in a drier year with less imported gas; that preliminary rise does not change the trend, but shows that the remaining plants are still the back-up in difficult years.
View the data as a table
| Chile | |
|---|---|
| 2000 | 8.5 TWh |
| 2001 | 4.8 TWh |
| 2002 | 5.0 TWh |
| 2003 | 4.9 TWh |
| 2004 | 7.7 TWh |
| 2005 | 7.2 TWh |
| 2006 | 10.6 TWh |
| 2007 | 13.3 TWh |
| 2008 | 14.1 TWh |
| 2009 | 14.9 TWh |
| 2010 | 16.9 TWh |
| 2011 | 19.6 TWh |
| 2012 | 25.3 TWh |
| 2013 | 30.2 TWh |
| 2014 | 26.0 TWh |
| 2015 | 28.0 TWh |
| 2016 | 30.3 TWh |
| 2017 | 29.3 TWh |
| 2018 | 29.9 TWh |
| 2019 | 28.1 TWh |
| 2020 | 26.1 TWh |
| 2021 | 26.1 TWh |
| 2022 | 21.5 TWh |
| 2023 | 14.5 TWh |
| 2024 | 13.6 TWh |
| 2025 | 15.7 TWh |
Chile's coal exit combines closures and conversions. Engie converted its IEM plant in Mejillones to gas, the country's first conversion, as we reported in our story on IEM, and won environmental approval to do the same with Andina and Hornitos. Meanwhile, the grid operator monitors coal supply for the plants still running, such as Angamos, according to our story on that monitoring.
What's next for coal power
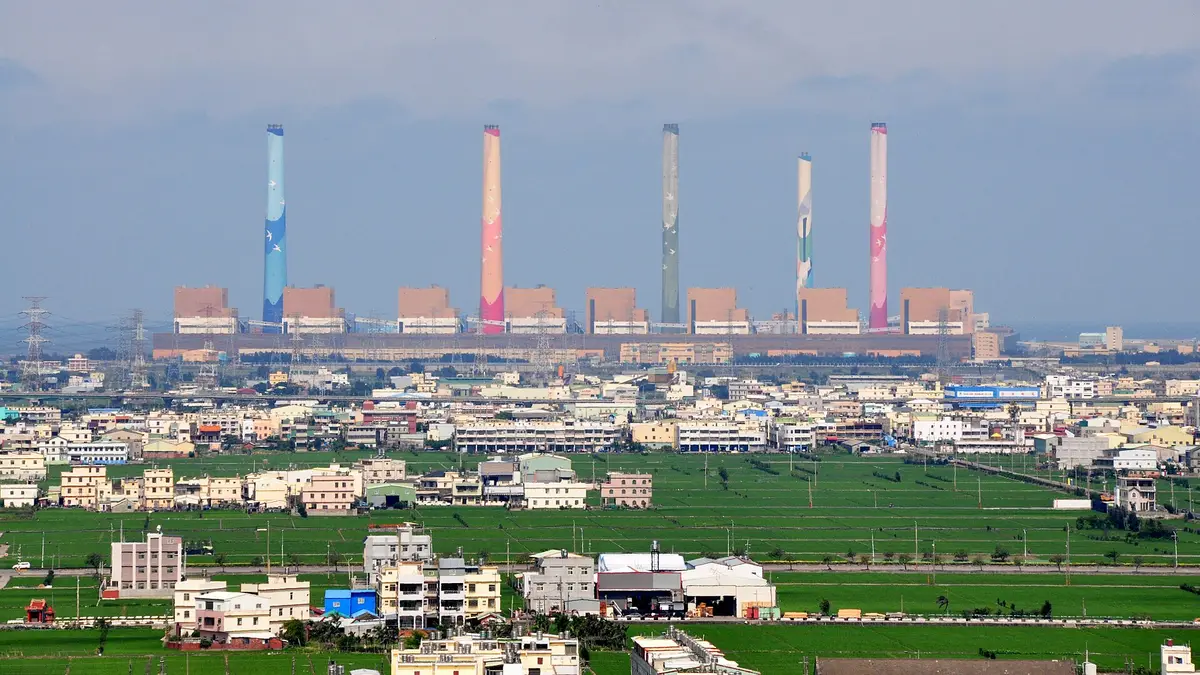
Preliminary 2025 data show coal generation fell in China (−1.3%) and India (−2.9%), the two largest users, while solar and wind covered almost all demand growth. If the trend holds, 2024 could stand as the year of peak coal power in history. But electricity use is growing fast, with data centres, air conditioning and electrification, and China's per capita consumption already exceeds that of many European countries, as shown in our ranking of electricity consumption per capita.
For Chile, the commitment is to close or convert all its coal plants before 2040. With more than 3,100 MW of batteries operating and new transmission lines under construction, the system needs coal less and less to cover the night, although dry years still call on it.
The country ranking is not the same as the emissions ranking: a country can generate a lot of electricity from coal and still emit less per person than another with a smaller population. Nor does it include coal used directly in industry, such as steel or cement, which in China and India is a large part of total coal use.
| 1 | China | 5,827.6 | 57.8 | 5,751.6 |
| 2 | India | 1,517.9 | 74.5 | 1,474.2 |
| 3 | United States | 652.2 | 14.9 | 737.1 |
| 4 | Japan | 327.1 | 32.2 | 330.1 |
| 5 | Indonesia | 228.4 | 61.5 | No data |
| 6 | Russia | 215.2 | 17.8 | 219.5 |
| 7 | South Africa | 206.8 | 83.6 | 197.5 |
| 8 | South Korea | 190.8 | 30.5 | 194.5 |
| 9 | Vietnam | 152.8 | 50.3 | 149.2 |
| 10 | Australia | 127.3 | 45.2 | 122.3 |
| 11 | Turkey | 121.3 | 35.6 | 121.4 |
| 12 | Taiwan | 115.6 | 40.1 | 104.5 |
| 13 | Germany | 106.3 | 21.4 | 103.2 |
| 14 | Poland | 93.5 | 54.3 | 87.3 |
| 15 | Malaysia | 85.3 | 43.1 | 89.6 |
| 16 | Philippines | 79.4 | 63.9 | 72.2 |
| 17 | Kazakhstan | 64.0 | 54.0 | 67.1 |
| 18 | Thailand | 33.3 | 16.7 | 33.6 |
| 19 | Czechia | 26.5 | 36.4 | 26.6 |
| 20 | Morocco | 26.2 | 61.7 | 27.4 |
| 21 | Canada | 25.1 | 3.9 | 26.7 |
| 22 | Pakistan | 24.4 | 13.9 | 28.9 |
| 23 | Serbia | 23.3 | 62.9 | 23.8 |
| 24 | Bangladesh | 20.3 | 19.9 | 22.2 |
| 25 | Brazil | 16.2 | 2.2 | 17.2 |
| 26 | Chile | 13.6 | 15.3 | 15.7 |
| 27 | Hong Kong | 12.6 | 33.7 | No data |
| 28 | Mexico | 12.4 | 3.5 | 10.9 |
| 29 | Laos | 12.2 | 23.3 | No data |
| 30 | Israel | 11.5 | 14.3 | 2.8 |
| 31 | Colombia | 11.2 | 12.6 | 5.5 |
| 32 | Cambodia | 9.4 | 60.9 | 10.1 |
| 33 | North Korea | 9.2 | 34.1 | No data |
| 34 | Bosnia and Herzegovina | 9.1 | 58.7 | 8.0 |
| 35 | Bulgaria | 8.8 | 22.9 | 8.6 |
| 36 | Mongolia | 7.5 | 84.7 | 8.3 |
| 37 | Netherlands | 7.5 | 6.1 | 9.6 |
| 38 | Dominican Republic | 7.2 | 30.0 | 6.6 |
| 39 | Romania | 7.1 | 13.4 | 6.7 |
| 40 | Uzbekistan | 5.7 | 7.0 | 5.7 |
| 41 | Sri Lanka | 5.6 | 32.9 | 4.8 |
| 42 | Zimbabwe | 4.4 | 42.9 | No data |
| 43 | Italy | 4.0 | 1.5 | 3.7 |
| 44 | Slovenia | 3.5 | 20.9 | 2.2 |
| 45 | Botswana | 3.4 | 98.3 | No data |
| 46 | Greece | 3.3 | 5.7 | 2.7 |
| 47 | Puerto Rico | 3.2 | 16.0 | 3.4 |
| 48 | Spain | 2.6 | 0.9 | 0.9 |
| 49 | Guatemala | 2.5 | 15.8 | No data |
| 50 | Hungary | 2.4 | 6.4 | 1.4 |
| 51 | North Macedonia | 2.4 | 37.4 | 2.1 |
| 52 | Zambia | 2.1 | 10.8 | No data |
| 53 | United Kingdom | 1.9 | 0.7 | 0.3 |
| 54 | Denmark | 1.8 | 5.0 | 0.9 |
| 55 | Kyrgyzstan | 1.5 | 9.7 | 2.0 |
| 56 | Montenegro | 1.4 | 40.5 | 0.6 |
| 57 | Mauritius | 1.3 | 39.3 | No data |
| 58 | Argentina | 1.3 | 0.9 | 2.8 |
| 59 | Myanmar | 1.2 | 5.5 | No data |
| 60 | New Zealand | 1.2 | 2.7 | 0.5 |
| 61 | New Caledonia | 1.1 | 36.5 | No data |
| 62 | Brunei | 1.1 | 19.8 | No data |
| 63 | France | 1.0 | 0.2 | 1.7 |
| 64 | Tajikistan | 1.0 | 4.5 | 1.1 |
| 65 | Finland | 0.8 | 1.0 | 0.2 |
| 66 | Croatia | 0.8 | 5.2 | 0.7 |
| 67 | Iran | 0.7 | 0.2 | 0.7 |
| 68 | Ireland | 0.6 | 2.0 | 0.2 |
| 69 | Singapore | 0.6 | 1.0 | 0.6 |
| 70 | Slovakia | 0.5 | 1.8 | 0.3 |
| 71 | Madagascar | 0.5 | 20.6 | No data |
| 72 | Panama | 0.5 | 3.7 | No data |
| 73 | Niger | 0.2 | 17.9 | No data |
| 74 | Rwanda | 0.2 | 15.0 | No data |
| 75 | Senegal | 0.1 | 1.3 | No data |
| 76 | Honduras | 0.1 | 0.5 | No data |
| 77 | Namibia | 0.0 | 2.4 | No data |
| 78 | Afghanistan | 0.0 | 3.0 | No data |
| 79 | Belarus | 0.0 | 0.0 | 0.0 |
| 80 | Eswatini | 0.0 | 3.3 | No data |
Methodology
The data come from Ember, which compiles official electricity generation statistics by source for more than 200 countries, processed by Our World in Data. Coal generation includes electricity from coal, lignite and other solid fossil fuel plants. The ranking uses 2024 because it is the last year with data for all countries; for 2025, Ember only has preliminary figures for about 90 countries, and some are missing, such as Indonesia and Hong Kong. Percentages refer to each country's generation.
How to cite this data
Energía Futura (2026). "Countries that generate the most electricity from coal 2026: world ranking and Chile's place". Updated on 11 November 2026. energiafutura.cl/en/news/countries-that-generate-the-most-electricity-from-coal-2026-world-ranking-and-chiles-place. Data: Ember (2026), Yearly Electricity Data, processed by Our World in Data.
Does your company work in decarbonisation, storage or renewable energy? Reach Energía Futura's readers.
See advertising formatsFrequently asked questions
Which country generates the most electricity from coal?
China, with 5,828 TWh in 2024, 55.3% of the world total and 57.8% of its own electricity.
How much electricity is generated from coal worldwide?
10,539 TWh in 2024, a record, equivalent to 34.1% of the world's electricity. In 2025 it fell to 10,472 TWh (33.0%), according to preliminary data.
Where does Chile rank?
26th of 80 countries, with 13.6 TWh in 2024, 15.3% of its electricity. In 2025 it rose to 15.7 TWh (17.8%).
Which country depends most on coal?
Botswana, with 98.3% of its electricity, followed by Mongolia (84.7%) and South Africa (83.6%).
Is the use of coal for electricity falling?
Its share has been falling since 2007, when it reached 40.8%. In volume, 2025 marked the first decline since 2020, of 0.6%, according to preliminary data.