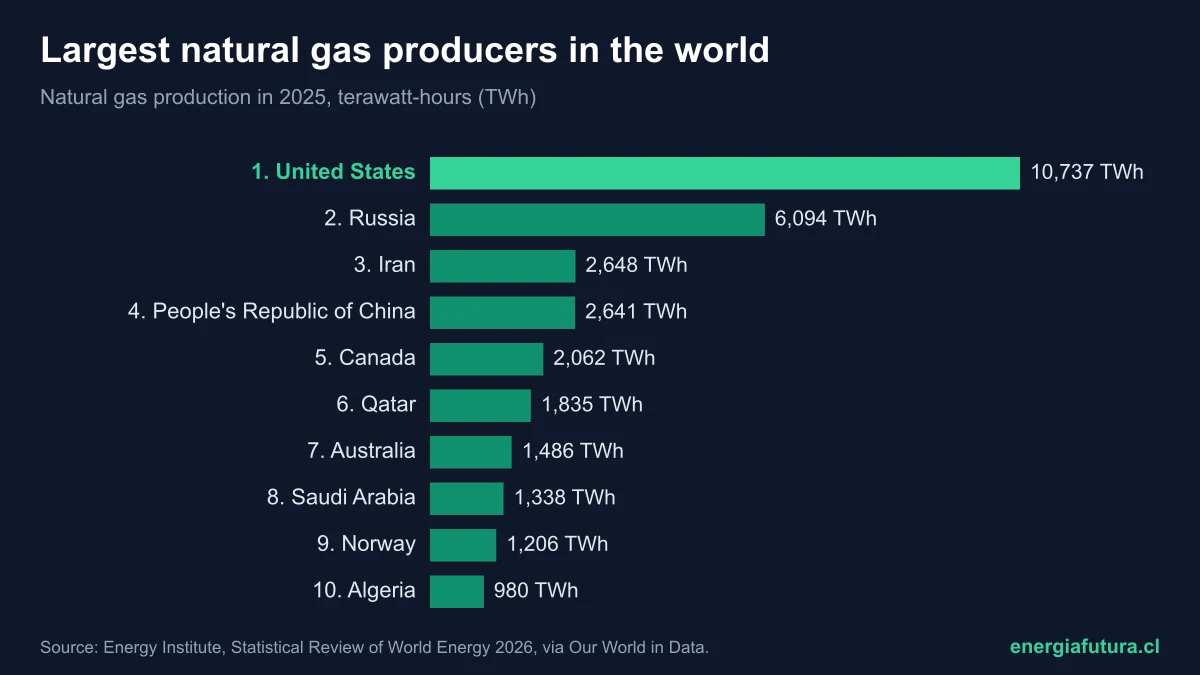
Updated on 18 November 2026. The United States is the world's largest natural gas producer: it produced 10,737 terawatt-hours (TWh) in 2025, 25.6% of the world total and 76% more than Russia, in second place, according to the 2026 edition of the Energy Institute's Statistical Review of World Energy. It is followed by Russia (14.5%), Iran (6.3%), China (6.3%) and Canada (4.9%). Argentina leads Latin America, in 17th place.
World natural gas production grew 1.3% in 2025 to 41,965 TWh, about 4.2 trillion cubic metres. This ranking orders countries by their 2025 output using Energy Institute data processed by Our World in Data, which expresses gas in energy terms (TWh) so it can be compared with oil and coal.
View the data as a table
| US share | 25.6% |
| World production | 41,965 TWh |
| China's growth since 2015 | +95% |
| Argentina in the world ranking | N.º 17 |
Ranking of the largest natural gas producers in the world in 2025
| # | Country | 2025 production (TWh) | % of world | Change vs. 2024 | 2015 production (TWh) |
|---|---|---|---|---|---|
| 1 | United States | 10,737 | 25.6% | +4.1% | 7,403 |
| 2 | Russia | 6,094 | 14.5% | −3.3% | 5,844 |
| 3 | Iran | 2,648 | 6.3% | +1.0% | 1,835 |
| 4 | China | 2,641 | 6.3% | +6.3% | 1,357 |
| 5 | Canada | 2,062 | 4.9% | +3.4% | 1,608 |
| 6 | Qatar | 1,835 | 4.4% | +2.1% | 1,759 |
| 7 | Australia | 1,486 | 3.5% | −2.4% | 743 |
| 8 | Saudi Arabia | 1,338 | 3.2% | +8.2% | 992 |
| 9 | Norway | 1,206 | 2.9% | −3.0% | 1,148 |
| 10 | Algeria | 980 | 2.3% | −2.2% | 814 |
| 11 | Malaysia | 802 | 1.9% | +0.5% | 768 |
| 12 | Turkmenistan | 724 | 1.7% | −1.4% | 659 |
| 13 | Indonesia | 718 | 1.7% | +0.6% | 866 |
| 14 | United Arab Emirates | 586 | 1.4% | +4.0% | 586 |
| 15 | Nigeria | 508 | 1.2% | +8.4% | 476 |
Source: Energy Institute, Statistical Review of World Energy 2026, via Our World in Data (production in TWh, 2025 and 2015 data). As a reference, one trillion (10¹²) cubic metres of gas is equivalent to about 10,000 TWh.
View the data as a table
| TWh | |
|---|---|
| United States | 10,737 TWh |
| Russia | 6,094 TWh |
| Iran | 2,648 TWh |
| People's Republic of China | 2,641 TWh |
| Canada | 2,062 TWh |
| Qatar | 1,835 TWh |
| Australia | 1,486 TWh |
| Saudi Arabia | 1,338 TWh |
| Norway | 1,206 TWh |
| Algeria | 980 TWh |
| Malaysia | 802 TWh |
| Turkmenistan | 724 TWh |
| Indonesia | 718 TWh |
| United Arab Emirates | 586 TWh |
| Nigeria | 508 TWh |
| Oman | 456 TWh |
| Argentina | 452 TWh |
| Egypt | 408 TWh |
| Uzbekistan | 400 TWh |
| Kazakhstan | 384 TWh |
| Azerbaijan | 378 TWh |
| Mexico | 348 TWh |
| India | 312 TWh |
| Venezuela | 310 TWh |
| United Kingdom | 299 TWh |
| Thailand | 294 TWh |
| Brazil | 266 TWh |
| Israel | 259 TWh |
| Pakistan | 249 TWh |
| Trinidad and Tobago | 238 TWh |
| Bangladesh | 180 TWh |
| Ukraine | 161 TWh |
| Bahrain | 160 TWh |
| Kuwait | 155 TWh |
| Peru | 155 TWh |
| Myanmar | 139 TWh |
| Libya | 117 TWh |
| Iraq | 109 TWh |
| Brunei Darussalam | 105 TWh |
| Colombia | 94 TWh |
| Romania | 89 TWh |
| Bolivia | 86 TWh |
| Netherlands | 78 TWh |
| Vietnam | 58 TWh |
| Germany | 37 TWh |
| Poland | 34 TWh |
| Syrian Arab Republic | 33 TWh |
| Italy | 33 TWh |
| Denmark | 31 TWh |
| 1 | United States | 10,737 | 25.6% | 4.1% |
| 2 | Russia | 6,094 | 14.5% | -3.3% |
| 3 | Iran | 2,648 | 6.3% | 1.0% |
| 4 | China | 2,641 | 6.3% | 6.3% |
| 5 | Canada | 2,062 | 4.9% | 3.4% |
| 6 | Qatar | 1,835 | 4.4% | 2.1% |
| 7 | Australia | 1,486 | 3.5% | -2.4% |
| 8 | Saudi Arabia | 1,338 | 3.2% | 8.2% |
| 9 | Norway | 1,206 | 2.9% | -3.0% |
| 10 | Algeria | 980 | 2.3% | -2.2% |
| 11 | Malaysia | 802 | 1.9% | 0.5% |
| 12 | Turkmenistan | 724 | 1.7% | -1.4% |
| 13 | Indonesia | 718 | 1.7% | 0.6% |
| 14 | United Arab Emirates | 586 | 1.4% | 4.0% |
| 15 | Nigeria | 508 | 1.2% | 8.4% |
| 16 | Oman | 456 | 1.1% | 0.6% |
| 17 | Argentina | 452 | 1.1% | 2.4% |
| 18 | Egypt | 408 | 1.0% | -14.2% |
| 19 | Uzbekistan | 400 | 1.0% | 1.9% |
| 20 | Kazakhstan | 384 | 0.9% | 15.0% |
| 21 | Azerbaijan | 378 | 0.9% | 0.2% |
| 22 | Mexico | 348 | 0.8% | -2.9% |
| 23 | India | 312 | 0.7% | -3.7% |
| 24 | Venezuela | 310 | 0.7% | -2.2% |
| 25 | United Kingdom | 299 | 0.7% | -2.6% |
| 26 | Thailand | 294 | 0.7% | 2.9% |
| 27 | Brazil | 266 | 0.6% | 16.3% |
| 28 | Israel | 259 | 0.6% | 0.4% |
| 29 | Pakistan | 249 | 0.6% | -4.4% |
| 30 | Trinidad and Tobago | 238 | 0.6% | -2.5% |
| 31 | Bangladesh | 180 | 0.4% | -8.8% |
| 32 | Ukraine | 161 | 0.4% | -11.2% |
| 33 | Bahrain | 160 | 0.4% | -3.4% |
| 34 | Kuwait | 155 | 0.4% | 0.1% |
| 35 | Peru | 155 | 0.4% | -3.1% |
| 36 | Myanmar | 139 | 0.3% | -0.8% |
| 37 | Libya | 117 | 0.3% | -5.1% |
| 38 | Iraq | 109 | 0.3% | 4.0% |
| 39 | Brunei Darussalam | 105 | 0.3% | 1.3% |
| 40 | Colombia | 94 | 0.2% | -15.2% |
| 41 | Romania | 89 | 0.2% | -0.7% |
| 42 | Bolivia | 86 | 0.2% | -15.0% |
| 43 | Netherlands | 78 | 0.2% | -6.8% |
| 44 | Vietnam | 58 | 0.1% | -5.6% |
| 45 | Germany | 37 | 0.1% | 2.1% |
| 46 | Poland | 34 | 0.1% | -4.3% |
| 47 | Syria | 33 | 0.1% | -5.9% |
| 48 | Italy | 33 | 0.1% | 16.6% |
| 49 | Denmark | 31 | 0.1% | 83.1% |
How the United States overtook Russia as the largest gas producer
In 2000 Russia was the world's largest gas producer, with 5,371 TWh, just ahead of the United States (5,186 TWh). Horizontal drilling and hydraulic fracturing in shale formations such as Marcellus, in Pennsylvania, and Haynesville, in Louisiana and Texas, changed the order: the United States overtook Russia in 2011 (6,174 versus 6,168 TWh) and has widened the gap ever since. In 2025 it produced 2.1 times its 2000 output.
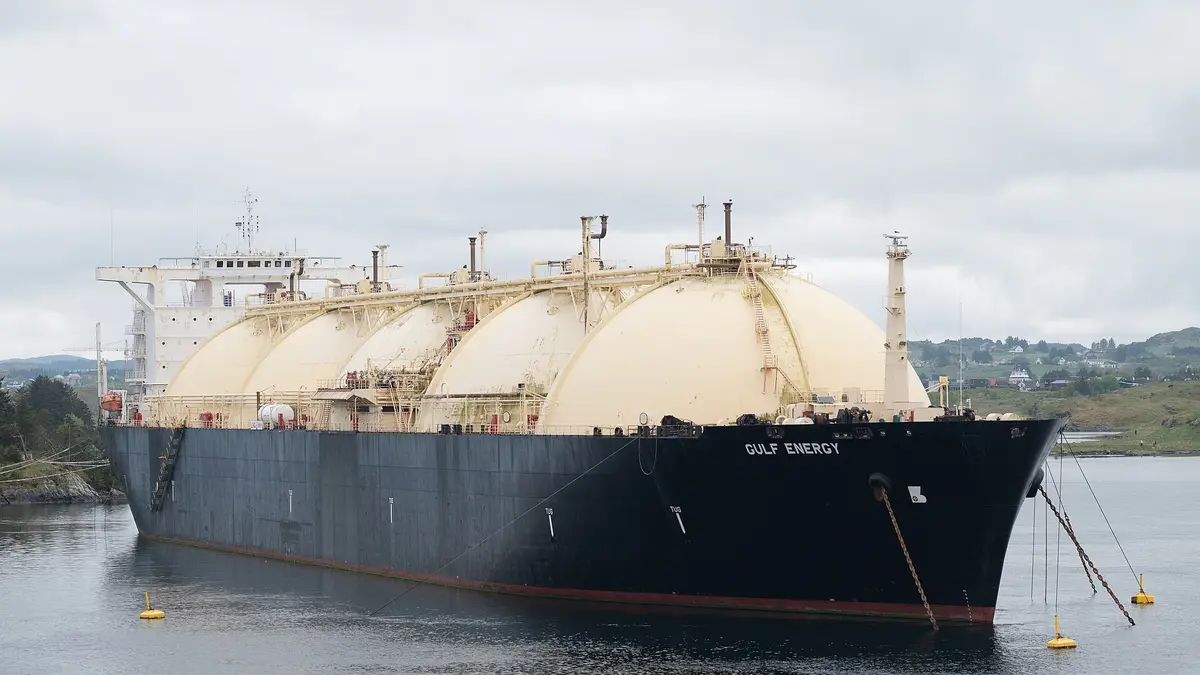
That gas does not stay at home. Liquefied and shipped on LNG carriers, it made the United States the world's largest exporter of liquefied natural gas (LNG) in 2023, according to the EIA, ahead of Australia and Qatar. Russia, by contrast, produced 3.3% less in 2025 than in 2024 and remains below its 2021 peak (7,021 TWh), after losing much of its pipeline sales to Europe.
View the data as a table
| 2000 | 2001 | 2002 | 2003 | 2004 | 2005 | 2006 | 2007 | 2008 | 2009 | 2010 | 2011 | 2012 | 2013 | 2014 | 2015 | 2016 | 2017 | 2018 | 2019 | 2020 | 2021 | 2022 | 2023 | 2024 | 2025 | |
|---|---|---|---|---|---|---|---|---|---|---|---|---|---|---|---|---|---|---|---|---|---|---|---|---|---|---|
| United States | 5,186 TWh | 5,319 TWh | 5,112 TWh | 5,179 TWh | 5,031 TWh | 4,894 TWh | 5,017 TWh | 5,219 TWh | 5,461 TWh | 5,576 TWh | 5,752 TWh | 6,174 TWh | 6,491 TWh | 6,557 TWh | 7,047 TWh | 7,403 TWh | 7,274 TWh | 7,471 TWh | 8,409 TWh | 9,281 TWh | 9,248 TWh | 9,445 TWh | 9,907 TWh | 10,289 TWh | 10,319 TWh | 10,737 TWh |
| Russia | 5,371 TWh | 5,348 TWh | 5,475 TWh | 5,706 TWh | 5,826 TWh | 5,895 TWh | 6,048 TWh | 6,016 TWh | 6,115 TWh | 5,362 TWh | 5,984 TWh | 6,168 TWh | 6,019 TWh | 6,145 TWh | 5,912 TWh | 5,844 TWh | 5,893 TWh | 6,356 TWh | 6,691 TWh | 6,790 TWh | 6,384 TWh | 7,021 TWh | 6,184 TWh | 5,864 TWh | 6,299 TWh | 6,094 TWh |
| Iran | 563 TWh | 626 TWh | 744 TWh | 781 TWh | 910 TWh | 966 TWh | 1,053 TWh | 1,180 TWh | 1,236 TWh | 1,357 TWh | 1,439 TWh | 1,510 TWh | 1,569 TWh | 1,575 TWh | 1,755 TWh | 1,835 TWh | 1,993 TWh | 2,139 TWh | 2,201 TWh | 2,283 TWh | 2,358 TWh | 2,428 TWh | 2,477 TWh | 2,597 TWh | 2,622 TWh | 2,648 TWh |
| China | 274 TWh | 306 TWh | 329 TWh | 353 TWh | 418 TWh | 497 TWh | 590 TWh | 698 TWh | 809 TWh | 859 TWh | 965 TWh | 1,062 TWh | 1,115 TWh | 1,218 TWh | 1,312 TWh | 1,357 TWh | 1,379 TWh | 1,492 TWh | 1,614 TWh | 1,767 TWh | 1,940 TWh | 2,092 TWh | 2,218 TWh | 2,343 TWh | 2,484 TWh | 2,641 TWh |
| Canada | 1,763 TWh | 1,794 TWh | 1,807 TWh | 1,760 TWh | 1,767 TWh | 1,792 TWh | 1,794 TWh | 1,747 TWh | 1,665 TWh | 1,551 TWh | 1,496 TWh | 1,511 TWh | 1,503 TWh | 1,519 TWh | 1,590 TWh | 1,608 TWh | 1,691 TWh | 1,748 TWh | 1,801 TWh | 1,734 TWh | 1,697 TWh | 1,765 TWh | 1,895 TWh | 1,950 TWh | 1,995 TWh | 2,062 TWh |
| Qatar | 258 TWh | 279 TWh | 305 TWh | 325 TWh | 405 TWh | 474 TWh | 525 TWh | 654 TWh | 797 TWh | 924 TWh | 1,231 TWh | 1,504 TWh | 1,625 TWh | 1,679 TWh | 1,694 TWh | 1,759 TWh | 1,748 TWh | 1,705 TWh | 1,752 TWh | 1,772 TWh | 1,749 TWh | 1,770 TWh | 1,785 TWh | 1,810 TWh | 1,797 TWh | 1,835 TWh |
| Australia | 312 TWh | 326 TWh | 330 TWh | 337 TWh | 359 TWh | 382 TWh | 407 TWh | 428 TWh | 417 TWh | 467 TWh | 526 TWh | 545 TWh | 583 TWh | 606 TWh | 653 TWh | 743 TWh | 941 TWh | 1,103 TWh | 1,274 TWh | 1,461 TWh | 1,457 TWh | 1,479 TWh | 1,542 TWh | 1,507 TWh | 1,523 TWh | 1,486 TWh |
| Saudi Arabia | 473 TWh | 510 TWh | 539 TWh | 571 TWh | 624 TWh | 677 TWh | 698 TWh | 707 TWh | 764 TWh | 745 TWh | 833 TWh | 876 TWh | 944 TWh | 950 TWh | 973 TWh | 992 TWh | 1,053 TWh | 1,093 TWh | 1,121 TWh | 1,112 TWh | 1,131 TWh | 1,145 TWh | 1,167 TWh | 1,174 TWh | 1,236 TWh | 1,338 TWh |
| Norway | 501 TWh | 541 TWh | 655 TWh | 729 TWh | 792 TWh | 857 TWh | 882 TWh | 894 TWh | 971 TWh | 995 TWh | 1,046 TWh | 1,003 TWh | 1,131 TWh | 1,070 TWh | 1,063 TWh | 1,148 TWh | 1,147 TWh | 1,224 TWh | 1,200 TWh | 1,131 TWh | 1,101 TWh | 1,131 TWh | 1,228 TWh | 1,160 TWh | 1,243 TWh | 1,206 TWh |
| Algeria | 919 TWh | 865 TWh | 889 TWh | 939 TWh | 921 TWh | 849 TWh | 813 TWh | 816 TWh | 826 TWh | 766 TWh | 774 TWh | 796 TWh | 784 TWh | 793 TWh | 802 TWh | 814 TWh | 914 TWh | 930 TWh | 938 TWh | 870 TWh | 814 TWh | 1,011 TWh | 976 TWh | 1,015 TWh | 1,002 TWh | 980 TWh |
| Malaysia | 497 TWh | 490 TWh | 506 TWh | 527 TWh | 601 TWh | 677 TWh | 675 TWh | 676 TWh | 692 TWh | 662 TWh | 651 TWh | 670 TWh | 693 TWh | 726 TWh | 722 TWh | 768 TWh | 767 TWh | 796 TWh | 761 TWh | 775 TWh | 731 TWh | 790 TWh | 830 TWh | 780 TWh | 798 TWh | 802 TWh |
| Turkmenistan | 424 TWh | 463 TWh | 483 TWh | 534 TWh | 526 TWh | 569 TWh | 566 TWh | 616 TWh | 616 TWh | 333 TWh | 401 TWh | 563 TWh | 590 TWh | 590 TWh | 635 TWh | 659 TWh | 632 TWh | 587 TWh | 615 TWh | 632 TWh | 660 TWh | 793 TWh | 783 TWh | 763 TWh | 735 TWh | 724 TWh |
View the data as a table
| United States | Russia | Iran | China | Qatar | |
|---|---|---|---|---|---|
| 2000 | 5,186 | 5,371 | 563 | 274 | 258 |
| 2001 | 5,319 | 5,348 | 626 | 306 | 279 |
| 2002 | 5,112 | 5,475 | 744 | 329 | 305 |
| 2003 | 5,179 | 5,706 | 781 | 353 | 325 |
| 2004 | 5,031 | 5,826 | 910 | 418 | 405 |
| 2005 | 4,894 | 5,895 | 966 | 497 | 474 |
| 2006 | 5,017 | 6,048 | 1,053 | 590 | 525 |
| 2007 | 5,219 | 6,016 | 1,180 | 698 | 654 |
| 2008 | 5,461 | 6,115 | 1,236 | 809 | 797 |
| 2009 | 5,576 | 5,362 | 1,357 | 859 | 924 |
| 2010 | 5,752 | 5,984 | 1,439 | 965 | 1,231 |
| 2011 | 6,174 | 6,168 | 1,510 | 1,062 | 1,504 |
| 2012 | 6,491 | 6,019 | 1,569 | 1,115 | 1,625 |
| 2013 | 6,557 | 6,145 | 1,575 | 1,218 | 1,679 |
| 2014 | 7,047 | 5,912 | 1,755 | 1,312 | 1,694 |
| 2015 | 7,403 | 5,844 | 1,835 | 1,357 | 1,759 |
| 2016 | 7,274 | 5,893 | 1,993 | 1,379 | 1,748 |
| 2017 | 7,471 | 6,356 | 2,139 | 1,492 | 1,705 |
| 2018 | 8,409 | 6,691 | 2,201 | 1,614 | 1,752 |
| 2019 | 9,281 | 6,790 | 2,283 | 1,767 | 1,772 |
| 2020 | 9,248 | 6,384 | 2,358 | 1,940 | 1,749 |
| 2021 | 9,445 | 7,021 | 2,428 | 2,092 | 1,770 |
| 2022 | 9,907 | 6,184 | 2,477 | 2,218 | 1,785 |
| 2023 | 10,289 | 5,864 | 2,597 | 2,343 | 1,810 |
| 2024 | 10,319 | 6,299 | 2,622 | 2,484 | 1,797 |
| 2025 | 10,737 | 6,094 | 2,648 | 2,641 | 1,835 |
The other big change is China, which almost doubled its output since 2015 (+95%) to 2,641 TWh and moved into fourth place, just 7 TWh behind Iran. Even so, China is the world's largest gas importer, because its consumption is growing faster than its production. Australia, seventh, doubled its output in the last decade with its large LNG plants in Queensland and Western Australia.
Natural gas production by region
North America (United States, Canada and Mexico) produces 31.3% of the world's gas, with 13,148 TWh, and is the region that grew most in the last decade: 39% since 2015. It is followed by the CIS (Russia and its neighbours, 19%), the Middle East (18.1%), which rose 26% in ten years with Iran, Qatar and Saudi Arabia, and Asia Pacific (17.1%). Europe produces just 4.9% and fell 21% since 2015 with the closure of the Groningen field in the Netherlands and the decline of the North Sea.
| Region | 2025 production (TWh) | % of world | Change vs. 2024 | 2015 production (TWh) |
|---|---|---|---|---|
| North America | 13,148 | 31.3% | +3.8% | 9,490 |
| CIS (Russia and neighbours) | 7,984 | 19.0% | −1.9% | 7,482 |
| Middle East | 7,583 | 18.1% | +2.6% | 6,008 |
| Asia Pacific | 7,176 | 17.1% | +1.3% | 5,707 |
| Africa | 2,406 | 5.7% | −0.6% | 2,077 |
| Europe | 2,038 | 4.9% | −2.3% | 2,596 |
| South and Central America | 1,631 | 3.9% | −0.2% | 1,786 |
| World | 41,965 | 100% | +1.3% | 35,146 |
Source: Energy Institute, Statistical Review of World Energy 2026, via Our World in Data. Regions are those of the Energy Institute; the CIS groups Russia, Turkmenistan, Uzbekistan, Kazakhstan, Azerbaijan and other former Soviet countries.
The largest natural gas producers in Latin America
Argentina is Latin America's largest natural gas producer and 17th in the world, with 452 TWh in 2025, 2.4% more than in 2024, thanks to Vaca Muerta in Neuquén. It is followed by Mexico (348 TWh, 22nd), Venezuela (310 TWh, 24th), which has large reserves but produces less gas than in 2015, as with its oil, as shown in the ranking of the largest oil producers; Brazil (266 TWh, 27th), which grew most in the region (+16.3%) thanks to gas associated with pre-salt oil; and Trinidad and Tobago (238 TWh, 30th), an LNG exporter. Further behind are Peru (155 TWh), Colombia (94 TWh) and Bolivia (86 TWh), the last two with falls of 15%.
View the data as a table
| TWh | |
|---|---|
| Argentina | 452 TWh · World rank 17 |
| Mexico | 348 TWh · World rank 22 |
| Venezuela | 310 TWh · World rank 24 |
| Brazil | 266 TWh · World rank 27 |
| Trinidad and Tobago | 238 TWh · World rank 30 |
| Peru | 155 TWh · World rank 35 |
| Colombia | 94 TWh · World rank 40 |
| Bolivia | 86 TWh · World rank 42 |
| Country | World rank | 2025 production (TWh) | Change vs. 2024 | 2015 production (TWh) |
|---|---|---|---|---|
| Argentina | 17 | 452 | +2.4% | 355 |
| Mexico | 22 | 348 | −2.9% | 479 |
| Venezuela | 24 | 310 | −2.2% | 361 |
| Brazil | 27 | 266 | +16.3% | 238 |
| Trinidad and Tobago | 30 | 238 | −2.5% | 360 |
| Peru | 35 | 155 | −3.1% | — |
| Colombia | 40 | 94 | −15.2% | — |
| Bolivia | 42 | 86 | −15.0% | — |
Source: Energy Institute, Statistical Review of World Energy 2026, via Our World in Data. Chile produced 11.9 TWh in 2024 in Magallanes (latest data available) and is not in the 2025 ranking.
Chile depends almost entirely on imported gas. It receives LNG at the Quintero and Mejillones terminals and pipeline gas from Argentina, which in 2025 was its second-largest fossil fuel supplier, with about US$3 billion in natural gas and crude, according to the Uno Punto Cinco Foundation report. How much electricity each country generates with gas is in the ranking of countries that generate the most electricity from natural gas.
Does your company work in the energy transition, gas or hydrogen? Reach Energía Futura's readers.
See advertising optionsNatural gas and the energy transition
Gas emits about half as much CO2 as coal per unit of electricity, and many countries use it to back up solar and wind power. In Chile, for example, Engie converted its IEM coal plant in Mejillones to gas. But it is also a fossil fuel, and methane leaks in production and transport reduce its climate advantage.
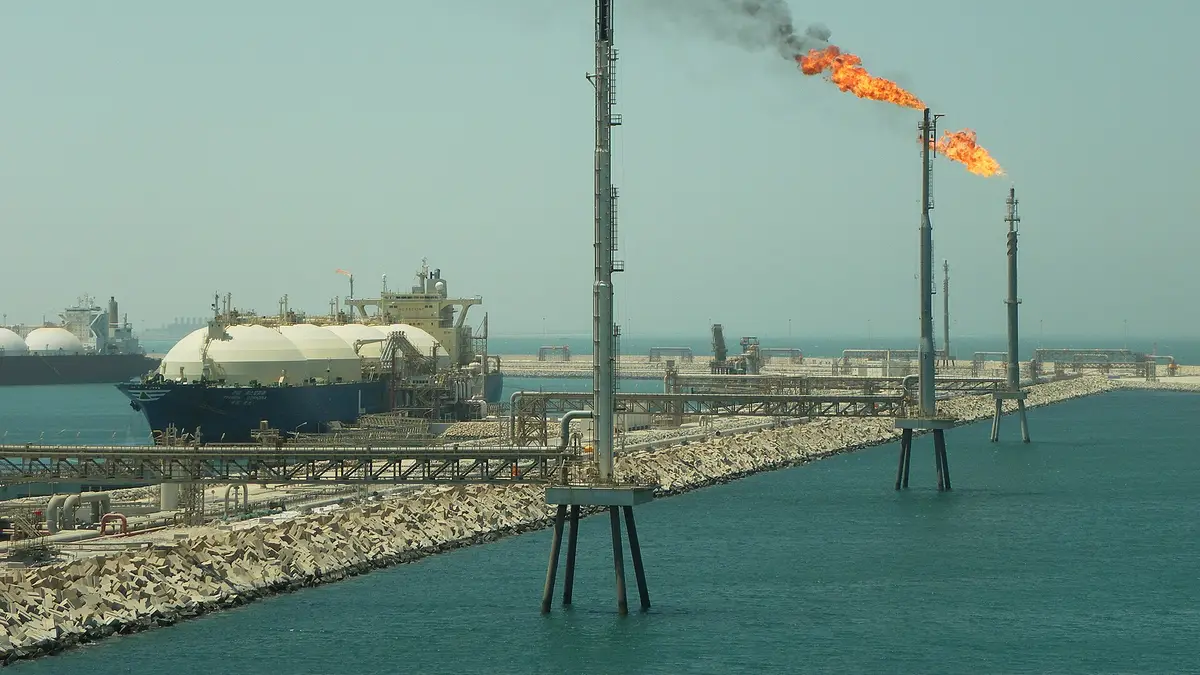
Gas also shapes geopolitics. Iran and Qatar, third and sixth in the ranking, share the world's largest gas field, which Iranians call South Pars and Qataris call the North Field. Qatar exports almost all its output as LNG, while Iran consumes most of it at home. Norway, ninth, became Europe's main pipeline gas supplier after 2022, when the European Union cut its purchases from Russia. And Algeria, tenth, supplies Spain and Italy through pipelines that cross the Mediterranean.
The figures in this ranking are for 2025, before the war with Iran. In 2026 the International Energy Agency has reported attacks on energy infrastructure and shipments from the Gulf, through which Qatar's and Iran's exports leave, so next year's ranking may show changes in the Middle East.
Methodology
2025 production in TWh is as published by Our World in Data using data from the Energy Institute's Statistical Review of World Energy 2026, supplemented with US EIA data for countries not covered. It measures marketed natural gas and excludes flared or reinjected gas. Regional aggregates are excluded from the country ranking; regional totals are those of the Energy Institute. The equivalence of 1 trillion cubic metres ≈ 10,000 TWh is approximate. Data downloaded on 18 November 2026.
How to cite this data
Energía Futura (2026). “Largest natural gas producing countries in the world 2026: ranking and Latin America”. Updated on 18 November 2026. energiafutura.cl/en/news/largest-natural-gas-producing-countries-in-the-world-2026-ranking-and-latin-america. Data: Energy Institute (2026), Statistical Review of World Energy.
Frequently asked questions
Which country is the largest natural gas producer in the world?
The United States, with 10,737 TWh in 2025, 25.6% of world production, according to the Energy Institute.
What are the top 5 natural gas producers?
The United States, Russia, Iran, China and Canada, in that order, in 2025.
Since when has the United States produced more gas than Russia?
Since 2011, according to the Energy Institute series in Our World in Data, thanks to shale gas.
Which is the largest gas producer in Latin America?
Argentina, 17th in the world, with 452 TWh in 2025, driven by Vaca Muerta.
Does Chile produce natural gas?
A little, in Magallanes: 11.9 TWh in 2024. Most of the gas it consumes is imported as LNG or by pipeline from Argentina.
Which country increased its gas output most in 2025?
Among the large producers, Brazil (+16.3%), Kazakhstan (+15%), Nigeria (+8.4%), Saudi Arabia (+8.2%) and China (+6.3%).