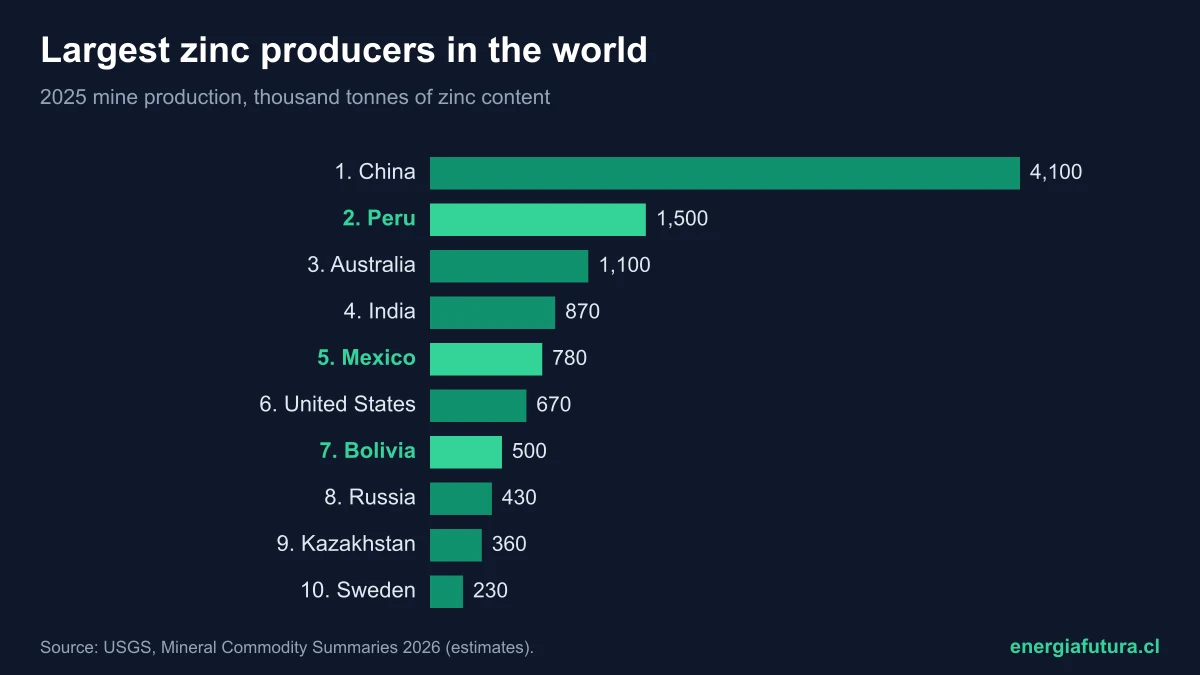
Updated on 8 November 2026. China is the world's largest zinc producer: in 2025 its mines extracted about 4.1 million tonnes of contained zinc, 31.5% of the world total of 13 million, according to the U.S. Geological Survey (USGS) zinc summary, Mineral Commodity Summaries 2026. Peru is second, with 1.5 million, and Australia third, with 1.1 million. With Mexico (fifth) and Bolivia (seventh), Latin America supplies 21.4% of the zinc mined on the planet.
Zinc is the metal that protects steel from rust: it is used mainly for galvanizing, which is why it is in the structures of solar and wind farms. This data sheet brings together the 2025 ranking, the trend since 2020, reserves by country and how much zinc the energy transition will require.
View the data as a table
| World mine production 2025 | 13 Mt |
| China's share | 31.5% |
| Peru, second producer | 1,500 kt |
| Latin America's share | 21.4% |
Ranking of the largest zinc producers in the world in 2025
The table ranks countries by 2025 mine production, measured as zinc content in concentrates, in thousand tonnes. 2025 figures are USGS estimates published in January 2026.
| Rank | Country | 2024 (kt) | 2025e (kt) | Share of 2025 total |
|---|---|---|---|---|
| 1 | China | 4,000 | 4,100 | 31.5% |
| 2 | Peru | 1,270 | 1,500 | 11.5% |
| 3 | Australia | 1,100 | 1,100 | 8.5% |
| 4 | India | 870 | 870 | 6.7% |
| 5 | Mexico | 773 | 780 | 6.0% |
| 6 | United States | 759 | 670 | 5.2% |
| 7 | Bolivia | 512 | 500 | 3.8% |
| 8 | Russia | 310 | 430 | 3.3% |
| 9 | Kazakhstan | 380 | 360 | 2.8% |
| 10 | Sweden | 239 | 230 | 1.8% |
| — | Other countries | 1,730 | 2,000 | 15.4% |
| World total | 11,900 | 13,000 | 100% |
Source: USGS, Mineral Commodity Summaries 2026. Percentages calculated by Energía Futura on the USGS rounded total. The 2024 figures for India, Kazakhstan and Russia are estimates. Chile is not among the countries the USGS details.
View the data as a table
| People's Republic of China | 4,100 |
| Peru | 1,500 |
| Australia | 1,100 |
| India | 870 |
| Mexico | 780 |
| United States | 670 |
| Bolivia | 500 |
| Russia | 430 |
| Kazakhstan | 360 |
| Sweden | 230 |
Peru, Mexico and Bolivia: Latin America's zinc producers
Peru raised its output from 1.27 to 1.5 million tonnes between 2024 and 2025, up 18%, getting close to its 2021 level again. It is also the main supplier of zinc concentrates to the United States: 50% of its imports between 2021 and 2024, according to the USGS. Mexico produced 780,000 tonnes and Bolivia 500,000. Together, the three countries mined 2.78 million tonnes.

In the region, zinc usually comes out together with other metals. In Peru, mines such as Antamina produce copper and zinc; in Bolivia and Mexico, zinc goes hand in hand with silver and lead, as our ranking of the largest silver producers in the world shows. So zinc output also depends on the prices and plans of the mines producing those other metals.
The largest zinc producers since 2020
World zinc output has moved little over the past five years: 12 million tonnes in 2020, 11.9 million in 2024 and 13 million in 2025. China stays close to 4 million a year. The changes are elsewhere: Australia fell from 1.31 to 1.1 million; India rose from 720,000 to 870,000 tonnes, and the United States dropped 12% in 2025 due to lower grades at the Red Dog mine in Alaska, which is nearing the end of its life, according to the USGS.
| Year | China | Peru | Australia | India | Mexico | Bolivia | World total |
|---|---|---|---|---|---|---|---|
| 2020 | 4,060 | 1,330 | 1,310 | 720 | 638 | 360 | 12,000 |
| 2021 | 4,140 | 1,530 | 1,320 | 777 | 724 | 500 | 12,700 |
| 2022 | 4,040 | 1,370 | 1,240 | 840 | 744 | 518 | 12,500 |
| 2023 | 4,060 | 1,470 | 1,090 | 854 | 584 | 492 | 12,100 |
| 2024 | 4,000 | 1,270 | 1,100 | 870 | 773 | 512 | 11,900 |
| 2025e | 4,100 | 1,500 | 1,100 | 870 | 780 | 500 | 13,000 |
Source: USGS, Mineral Commodity Summaries 2022 to 2026; for each year, the revised figure from the following edition is used. Thousand tonnes of contained zinc.
View the data as a table
| Peru | Australia | India | Mexico | Bolivia | |
|---|---|---|---|---|---|
| 2020 | 1,330 | 1,310 | 720 | 638 | 360 |
| 2021 | 1,530 | 1,320 | 777 | 724 | 500 |
| 2022 | 1,370 | 1,240 | 840 | 744 | 518 |
| 2023 | 1,470 | 1,090 | 854 | 584 | 492 |
| 2024 | 1,270 | 1,100 | 870 | 773 | 512 |
| 2025e | 1,500 | 1,100 | 870 | 780 | 500 |
View the data as a table
| 2020 | 2021 | 2022 | 2023 | 2024 | 2025e | |
|---|---|---|---|---|---|---|
| China | 4,060 | 4,140 | 4,040 | 4,060 | 4,000 | 4,100 |
| Peru | 1,330 | 1,530 | 1,370 | 1,470 | 1,270 | 1,500 |
| Australia | 1,310 | 1,320 | 1,240 | 1,090 | 1,100 | 1,100 |
| India | 720 | 777 | 840 | 854 | 870 | 870 |
| Mexico | 638 | 724 | 744 | 584 | 773 | 780 |
| United States | 718 | 704 | 761 | 767 | 759 | 670 |
| Bolivia | 360 | 500 | 518 | 492 | 512 | 500 |
| Russia | 280 | 280 | 300 | 300 | 310 | 430 |
| Kazakhstan | 222 | 194 | 312 | 340 | 380 | 360 |
| Sweden | 232 | 234 | 234 | 218 | 239 | 230 |
View the data as a table
| World | China | Rest of the world | |
|---|---|---|---|
| 2020 | 12,000 | 4,060 | 7,940 |
| 2021 | 12,700 | 4,140 | 8,560 |
| 2022 | 12,500 | 4,040 | 8,460 |
| 2023 | 12,100 | 4,060 | 8,040 |
| 2024 | 11,900 | 4,000 | 7,900 |
| 2025e | 13,000 | 4,100 | 8,900 |
Zinc reserves by country
World zinc reserves total 240 million tonnes, according to the USGS, and identified resources about 1.9 billion. Australia leads reserves with 64 million tonnes (19 million under the Australian JORC standard), followed by China (60 million) and Russia (29 million). Peru has 18 million and Mexico 14 million. Bolivia does not report its figure.
| Country | Reserves (kt) | Share of total |
|---|---|---|
| Australia | 64,000 | 26.7% |
| China | 60,000 | 25.0% |
| Russia | 29,000 | 12.1% |
| Peru | 18,000 | 7.5% |
| Mexico | 14,000 | 5.8% |
| India | 10,000 | 4.2% |
| United States | 9,300 | 3.9% |
| Kazakhstan | 7,400 | 3.1% |
| Sweden | 4,100 | 1.7% |
| Other countries | 25,000 | 10.4% |
| World total | 240,000 | 100% |
View the data as a table
| Australia | 64,000 |
| People's Republic of China | 60,000 |
| Russia | 29,000 |
| Peru | 18,000 |
| Mexico | 14,000 |
| India | 10,000 |
| United States | 9,300 |
| Kazakhstan | 7,400 |
| Sweden | 4,100 |
| China | 4,000 | 4,100 | 31.5 | 60,000 |
| Peru | 1,270 | 1,500 | 11.5 | 18,000 |
| Australia | 1,100 | 1,100 | 8.5 | 64,000 |
| India | 870 | 870 | 6.7 | 10,000 |
| Mexico | 773 | 780 | 6.0 | 14,000 |
| United States | 759 | 670 | 5.2 | 9,300 |
| Bolivia | 512 | 500 | 3.8 | No data |
| Russia | 310 | 430 | 3.3 | 29,000 |
| Kazakhstan | 380 | 360 | 2.8 | 7,400 |
| Sweden | 239 | 230 | 1.8 | 4,100 |
| Other countries | 1,730 | 2,000 | 15.4 | 25,000 |
Does your company work in mining, metals or structures for renewable energy? Reach Energía Futura's readers.
See advertising optionsZinc in solar, wind and batteries
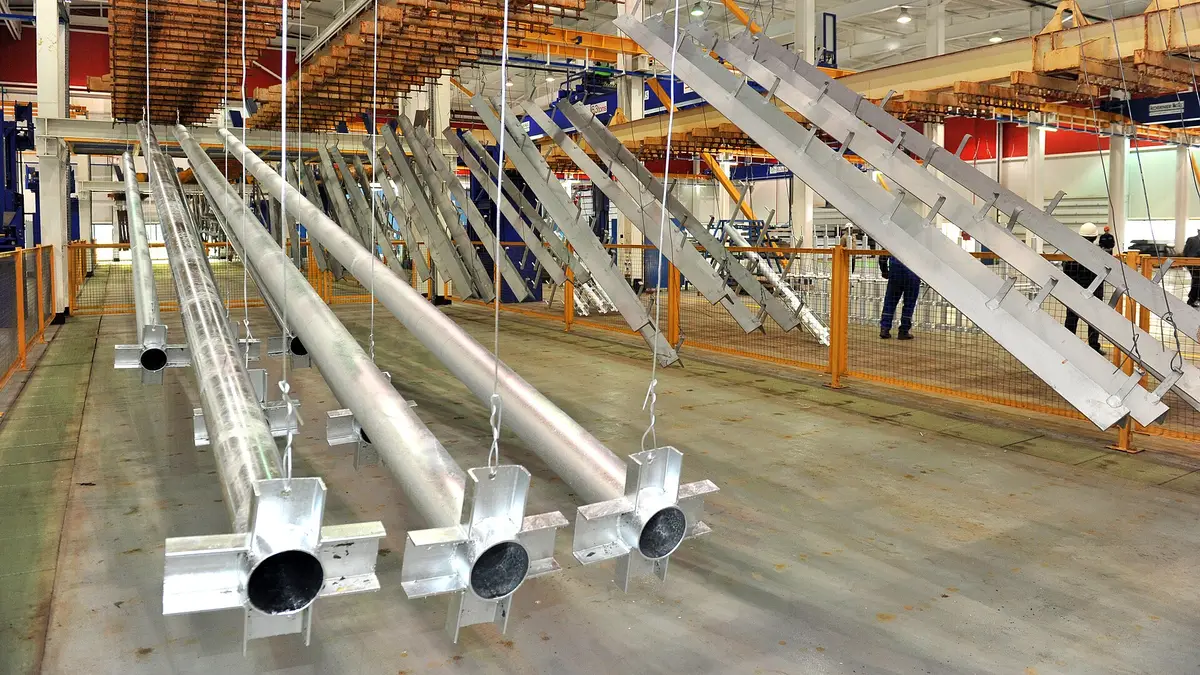
In the United States, the main use of refined zinc is galvanized steel, followed by brass and bronze, according to the USGS. Galvanizing coats steel with a layer of zinc that protects it from corrosion for decades, which is why it is in solar farm trackers and structures, transmission towers and parts of wind turbines.
The International Zinc Association (IZA) estimates that each megawatt of solar requires 2.4 tonnes of zinc; each megawatt of wind, 0.4 tonnes, and each megawatt-hour of storage in zinc batteries, 2 to 2.5 tonnes, according to its energy transition fact sheet. With those factors, IZA projects that by 2030 solar power will consume 568,000 tonnes of zinc a year; storage 43,000 and wind 41,000: about 652,000 tonnes, close to 5% of current mine output.
Applied to real projects, the IZA factor means a 100 MW solar farm needs about 240 tonnes of zinc, almost all of it in the coating that protects its structures. A project such as Soles del Norte, of about 220 MWp, approved in Coquimbo in November 2026, would require around 530 tonnes by the same calculation. Chile is not among the large zinc producers, so much of that metal arrives imported, as concentrate refined elsewhere or already built into galvanized steel.
The refined metal market, however, is loose. The International Lead and Zinc Study Group (ILZSG) forecast refined zinc output of 13.8 million tonnes in 2025 and consumption of 13.7 million, a surplus of 85,000 tonnes, driven by new refineries in China, as cited by the USGS. Copper, by contrast, faces a tighter market, as shown in our ranking of the largest copper producers in the world.
Zinc prices, trade and recycling
The USGS projected that the average zinc price on the London Metal Exchange (LME) would rise about 3% in 2025, to roughly 130 U.S. cents per pound, from 126 cents in 2024. The concentrate market depends on few exporters: between 2021 and 2024, 50% of the concentrates the United States imported came from Peru, 19% from Canada and 18% from Turkey. In refined zinc, Mexico supplied 15% of its purchases.
| Indicator | Figure | Source |
|---|---|---|
| LME price 2024 | 126 U.S. cents per pound | USGS |
| LME price 2025 (projection) | 130 U.S. cents per pound | USGS |
| Refined zinc output 2025 | 13.8 million t | ILZSG, via USGS |
| Refined zinc consumption 2025 | 13.7 million t | ILZSG, via USGS |
| Identified world resources | 1.9 billion t | USGS |
Zinc is also recycled. In the United States, part of the refined metal is recovered from galvanizing residues and from electric arc furnace dust, the furnaces that melt steel scrap, according to the USGS. It is a case similar to aluminum, which is recycled with a fraction of the electricity needed to make it from scratch, as we explain in the ranking of the largest aluminum producers in the world.
How to cite this data
Energía Futura (2026). "Largest zinc producers in the world 2026: country ranking, reserves and Latin America's place". Updated on 8 November 2026. energiafutura.cl/en/news/largest-zinc-producers-in-the-world-2026-country-ranking-reserves-and-latin-americas-place. Data: USGS, Mineral Commodity Summaries 2022-2026; International Zinc Association.
Frequently asked questions
Which is the world's largest zinc producer?
China, with about 4.1 million tonnes in 2025, 31.5% of the world total, according to the USGS.
Where does Peru rank in zinc production?
Second, with 1.5 million tonnes in 2025, 11.5% of the total.
How much zinc does the world produce?
About 13 million tonnes of contained zinc in 2025, up from 11.9 million in 2024.
Which country has the largest zinc reserves?
Australia, with 64 million tonnes, followed by China with 60 million.
Does Chile produce zinc?
Chile does not appear among the ten producers the USGS details; any output it has falls under "other countries".