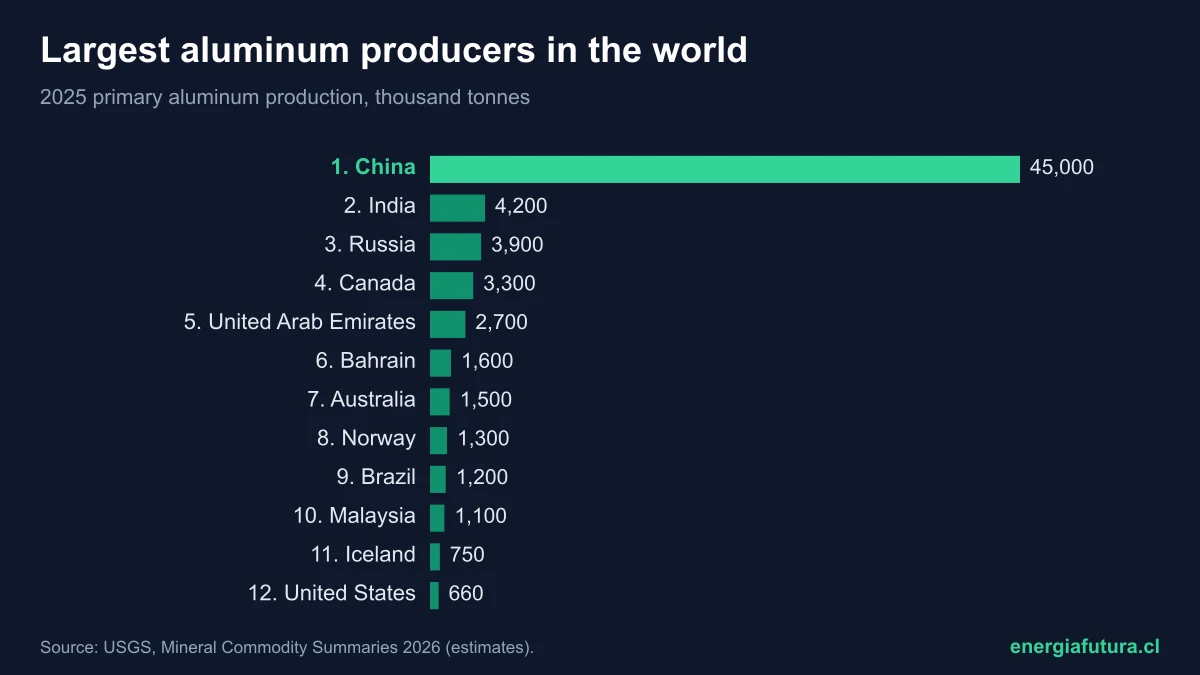
Updated on 7 November 2026. China is the world's largest aluminum producer: in 2025 its smelters produced about 45 million tonnes of primary aluminum, 60.8% of the world total of 74 million, according to the U.S. Geological Survey (USGS) aluminum summary, Mineral Commodity Summaries 2026. India is second with 4.2 million and Russia third with 3.9 million. Chile produces no primary aluminum.
Aluminum is the energy-transition metal that needs the most electricity: smelting one tonne takes on the order of 14 MWh. That is why where it is made, and with what electricity, defines its carbon footprint. This data sheet brings together the 2025 ranking, the trend since 2020, smelter capacity, the bauxite and alumina the metal comes from, and how much energy it consumes.
View the data as a table
| World primary aluminum output 2025 | 74 Mt |
| China's share | 60.8% |
| World growth since 2020 | 13.7% |
| Electricity per tonne | 14 MWh |
Ranking of the largest aluminum producers in the world in 2025
The table ranks countries by smelter output in 2025, in thousand tonnes of primary aluminum, the kind made from alumina rather than recycled scrap. The 2025 figures are USGS estimates.
| Rank | Country | 2024 (kt) | 2025e (kt) | Share of 2025 total |
|---|---|---|---|---|
| 1 | China | 44,000 | 45,000 | 60.8% |
| 2 | India | 4,200 | 4,200 | 5.7% |
| 3 | Russia | 3,880 | 3,900 | 5.3% |
| 4 | Canada | 3,320 | 3,300 | 4.5% |
| 5 | United Arab Emirates | 2,690 | 2,700 | 3.6% |
| 6 | Bahrain | 1,620 | 1,600 | 2.2% |
| 7 | Australia | 1,570 | 1,500 | 2.0% |
| 8 | Norway | 1,300 | 1,300 | 1.8% |
| 9 | Brazil | 1,100 | 1,200 | 1.6% |
| 10 | Malaysia | 1,050 | 1,100 | 1.5% |
| 11 | Iceland | 742 | 750 | 1.0% |
| 12 | United States | 676 | 660 | 0.9% |
| Other countries | 6,680 | 7,000 | 9.5% | |
| World total (rounded) | 72,800 | 74,000 | 100% |
Source: USGS, Mineral Commodity Summaries 2026. Shares calculated by Energía Futura on the USGS rounded total. Several 2024 figures (Brazil, India, Malaysia and Norway) are estimates; the USGS significantly revised Malaysia's 2024 output based on company and government reports.
View the data as a table
| People's Republic of China | 45,000 |
| India | 4,200 |
| Russia | 3,900 |
| Canada | 3,300 |
| United Arab Emirates | 2,700 |
| Bahrain | 1,600 |
| Australia | 1,500 |
| Norway | 1,300 |
| Brazil | 1,200 |
| Malaysia | 1,100 |
| Iceland | 750 |
| United States | 660 |
The largest aluminum producers since 2020
World primary aluminum output rose from 65.1 million tonnes in 2020 to 74 million in 2025, an increase of 13.7%. China accounts for almost all of that growth: it went from 37.1 to 45 million tonnes (+21.3%) and its share climbed from 57% to 60.8%. The rest of the world, combined, went from 28 to 29 million.
| Year | China | India | Russia | Canada | UAE | United States | World total |
|---|---|---|---|---|---|---|---|
| 2020 | 37,100 | 3,560 | 3,640 | 3,120 | 2,520 | 1,012 | 65,100 |
| 2021 | 38,900 | 3,970 | 3,640 | 3,140 | 2,540 | 889 | 67,500 |
| 2022 | 40,200 | 4,100 | 3,720 | 2,770 | 2,650 | 861 | 68,400 |
| 2023 | 41,600 | 4,100 | 3,700 | 3,200 | 2,660 | 750 | 70,000 |
| 2024 | 44,000 | 4,200 | 3,880 | 3,320 | 2,690 | 676 | 72,800 |
| 2025e | 45,000 | 4,200 | 3,900 | 3,300 | 2,700 | 660 | 74,000 |
Source: USGS, Mineral Commodity Summaries, 2022 to 2026 editions, in thousand tonnes. The most recent published figure is used for each year. The United States is China's mirror image: its output fell 35% in five years to 660,000 tonnes, with two smelters idle since 2022 and 2024.
View the data as a table
| World | China | Rest of the world | |
|---|---|---|---|
| 2020 | 65,100 | 37,100 | 28,000 |
| 2021 | 67,500 | 38,900 | 28,600 |
| 2022 | 68,400 | 40,200 | 28,200 |
| 2023 | 70,000 | 41,600 | 28,400 |
| 2024 | 72,800 | 44,000 | 28,800 |
| 2025e | 74,000 | 45,000 | 29,000 |
View the data as a table
| 2020 | 2021 | 2022 | 2023 | 2024 | 2025e | |
|---|---|---|---|---|---|---|
| India | 3,560 | 3,970 | 4,100 | 4,100 | 4,200 | 4,200 |
| Russia | 3,640 | 3,640 | 3,720 | 3,700 | 3,880 | 3,900 |
| Canada | 3,120 | 3,140 | 2,770 | 3,200 | 3,320 | 3,300 |
| United Arab Emirates | 2,520 | 2,540 | 2,650 | 2,660 | 2,690 | 2,700 |
| Bahrain | 1,550 | 1,560 | 1,600 | 1,620 | 1,620 | 1,600 |
| Australia | 1,580 | 1,570 | 1,510 | 1,560 | 1,570 | 1,500 |
| Norway | 1,330 | 1,400 | 1,400 | 1,300 | 1,300 | 1,300 |
| Brazil | No data | No data | 811 | 1,020 | 1,100 | 1,200 |
| Malaysia | No data | No data | 900 | 940 | 1,050 | 1,100 |
| Iceland | 860 | 750 | 720 | 770 | 742 | 750 |
| United States | 1,012 | 889 | 861 | 750 | 676 | 660 |
Smelter capacity: China is already at its limit
The USGS puts world smelting capacity at 79.7 million tonnes at the end of 2025, so the world used about 93% of its capacity. China produced 45 million with a capacity of 45 million: it ran flat out. The United States, by contrast, produced 660,000 tonnes with a capacity of 1.31 million: half its smelting capacity was idle or running at reduced rates.
| China | 44,000 | 45,000 | 45,000 | 100 |
| India | 4,200 | 4,200 | 4,200 | 100 |
| Russia | 3,880 | 3,900 | 4,080 | 96 |
| Canada | 3,320 | 3,300 | 3,310 | 100 |
| United Arab Emirates | 2,690 | 2,700 | 2,790 | 97 |
| Bahrain | 1,620 | 1,600 | 1,620 | 99 |
| Australia | 1,570 | 1,500 | 1,730 | 87 |
| Norway | 1,300 | 1,300 | 1,460 | 89 |
| Brazil | 1,100 | 1,200 | 1,280 | 94 |
| Malaysia | 1,050 | 1,100 | 1,080 | 102 |
| Iceland | 742 | 750 | 880 | 85 |
| United States | 676 | 660 | 1,310 | 50 |
| Other countries | 6,680 | 7,000 | 11,000 | 64 |
Trade also moved the market in 2025. The United States imposed a 25% tariff on aluminum and derivative products in March and doubled it to 50% for most countries in June, according to the USGS. The average ingot price in that market rose 39% to 180 cents per pound. Elsewhere, a 228,000-tonne smelter restarted in San Ciprián (Spain) and a 500,000-tonne smelter was preparing to start in Indonesia.
- March 2025U.S. sets a 25% tariffOn aluminum and derivatives, with no country exemptions.
- June 2025Tariff doubles to 50%For most countries, except the United Kingdom (25%).
- August 2025Guinea revokes bauxite licensesFrom a subsidiary of a UAE producer, after a refinery dispute.
- 2025San Ciprián restarts in Spain228,000 t/yr smelter idle since 2022.
- End of 2025New smelter in Indonesia500,000 t/yr in North Kalimantan.
- Mid-2026South Carolina restartOver 50,000 t/yr of idle capacity back in production.
Bauxite and alumina: where aluminum comes from
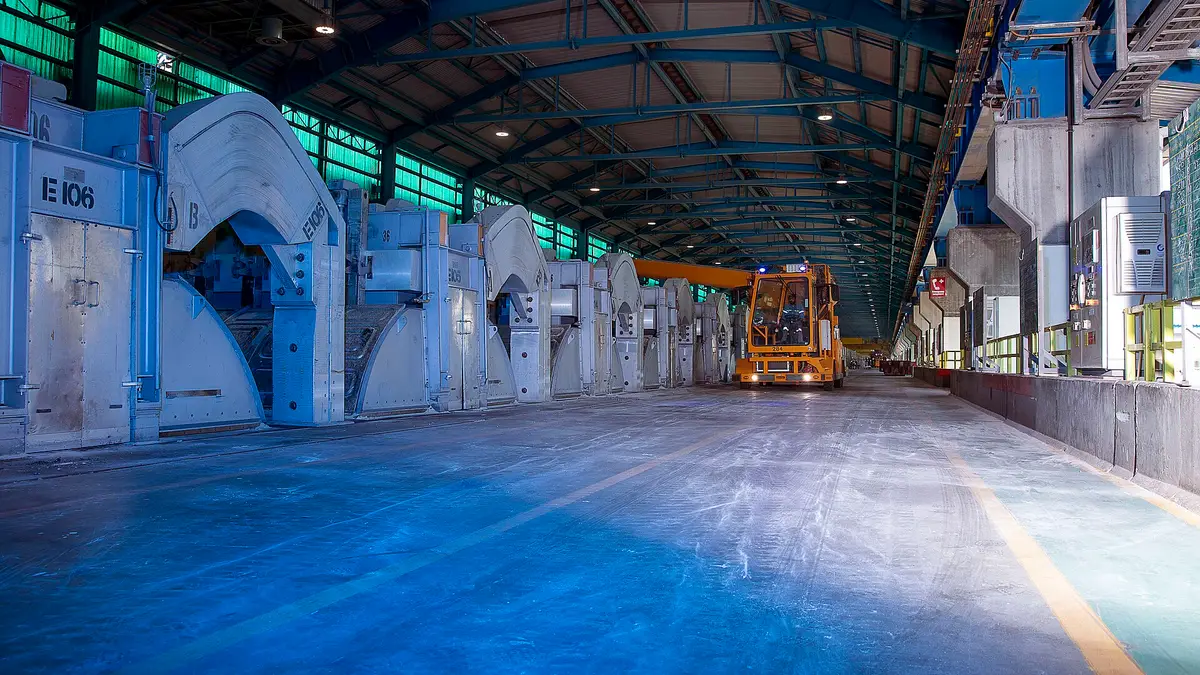
Aluminum is made in three steps. First bauxite, a reddish ore, is mined; then it is refined into alumina (aluminum oxide); finally the alumina is smelted with electricity. As a general rule, 4 tonnes of bauxite are needed to produce 2 tonnes of alumina, which in turn yield 1 tonne of aluminum, according to the USGS bauxite and alumina chapter.
Guinea is the largest bauxite producer, with 150 million tonnes in 2025, followed by Australia (97 million) and China (87 million). World output reached 440 million. Guinea also holds the largest reserves, 7.4 billion tonnes out of a world total of 29 billion. In refining, China leads again: it produced 93 million tonnes of alumina, 62% of the 150 million total.
View the data as a table
| Guinea | 7,400 |
| Australia | 3,700 |
| Vietnam | 3,100 |
| Indonesia | 2,900 |
| Jamaica | 2,000 |
| Brazil | 1,700 |
| People's Republic of China | 710 |
| India | 650 |
| Russia | 650 |
| Saudi Arabia | 180 |
| Kazakhstan | 160 |
| Türkiye | 69 |
| United States | 20 |
How much electricity aluminum uses
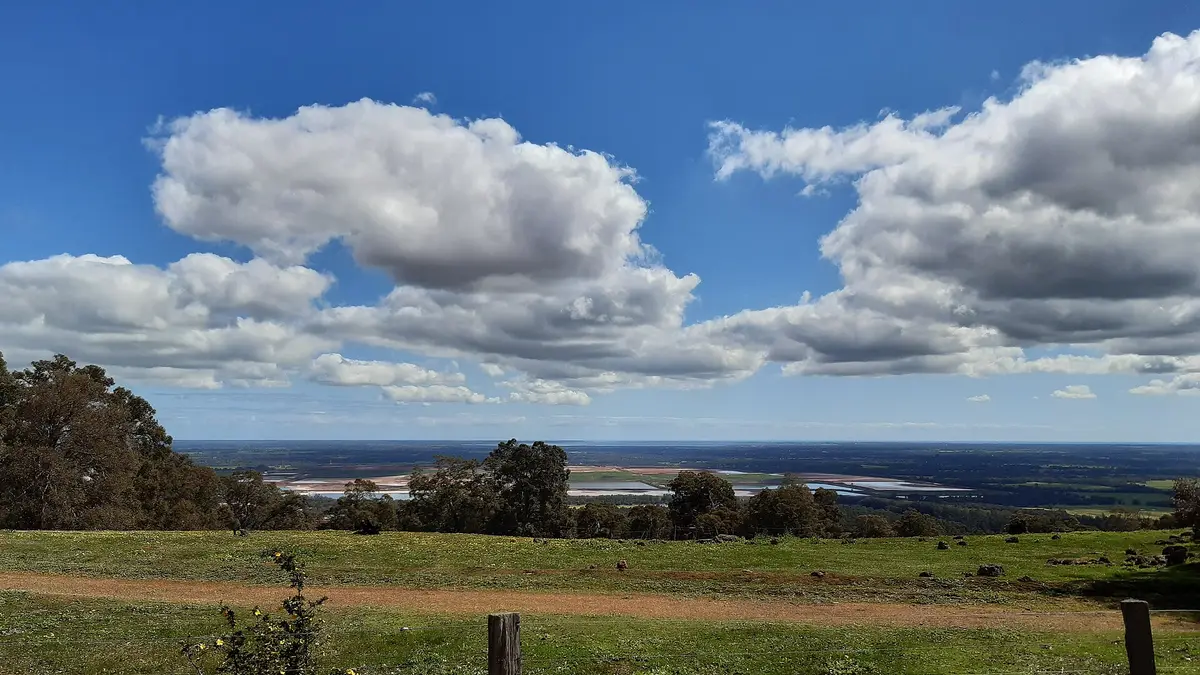
Smelting aluminum with the Hall-Héroult process takes about 14 MWh per tonne on average worldwide, according to a 2024 report by the European Commission's Joint Research Centre (JRC). The most modern pots do better: a Weiqiao smelter in China demonstrated 12,630 kWh per tonne with cells above 600 kA, according to a study published in Nature Climate Change.
With those averages, the 74 million tonnes of 2025 would have needed on the order of 1,000 TWh of electricity, an Energía Futura estimate: more than ten times what Chile generates in a year. That is why the source of that electricity is decisive. Smelters in Norway, Iceland and Canada run on hydropower or geothermal power, while many in China depend on coal, which explains why the same metal can carry very different carbon footprints.
Recycling changes the equation: making aluminum from scrap takes about 8.3 gigajoules per tonne, against 186 gigajoules for primary aluminum from mine to casthouse, a 95% saving, according to a 2024 International Aluminium Institute factsheet. In the United States, aluminum recovered from scrap reached about 3.6 million tonnes in 2025, more than five times its primary output, according to the USGS.
Does your company work in mining, metals or industrial energy? Reach Energía Futura's readers.
See advertising optionsWhat aluminum is used for
Aluminum is light, resists corrosion and conducts electricity well, so it appears in many clean technologies: solar panel frames, electric car bodies and battery enclosures, transmission cables and structures. In the United States, transportation took 36% of consumption in 2025, packaging 24%, building 13% and electrical uses 9%, according to the USGS.
In electrical uses, aluminum competes with copper, Chile's main export: the USGS notes that copper can replace aluminum in electrical and heat-exchange applications, and aluminum replaces copper in many cables. That is why the electrical industry watches both metals' prices closely: expensive aluminum favors copper and vice versa.
Chile and aluminum
Chile does not appear among the USGS producers: it has no primary aluminum smelters or bauxite mines. The most ambitious project was Alumysa, by Canada's Noranda, which sought to build a smelter in Aysén with three hydropower plants and a port, for about US$2.75 billion. The company suspended its environmental review in 2003 after opposition from authorities, salmon farmers, tourism operators and environmental groups, according to Diario Financiero.
The logic of that project, taking the metal to where clean energy is abundant, is back in discussion with the solar boom in northern Chile. Chilean mining already buys most of its electricity from renewable sources, as we showed in renewable energy in Chilean mining, and copper mining emissions fell in 2024 to their lowest level since 2010, as we reviewed in the carbon footprint of Chilean copper.
Aluminum thus joins the metals whose production is highly concentrated in China, like the silicon in solar panels we analyzed in the largest silicon producers. The difference is that its main input is not a scarce mineral but electricity.
How to cite this data
Energía Futura (2026). “Largest aluminum producers in the world 2026: country ranking, bauxite and the electricity it uses”. Updated on 7 November 2026. energiafutura.cl/en/news/largest-aluminum-producers-in-the-world-2026-country-ranking-bauxite-and-the-electricity-it-uses. Data: USGS, Mineral Commodity Summaries 2022-2026; JRC; International Aluminium Institute.
Frequently asked questions
Which country is the largest aluminum producer?
China, with about 45 million tonnes of primary aluminum in 2025, 60.8% of the world total, according to the USGS.
How much aluminum is produced in the world?
About 74 million tonnes of primary aluminum in 2025, up from 72.8 million in 2024.
Which country produces the most bauxite?
Guinea, with 150 million tonnes in 2025, followed by Australia (97 million) and China (87 million).
How much electricity does it take to produce aluminum?
On average, about 14 MWh per tonne of primary aluminum. Recycling saves about 95% of the energy.
What is aluminum used for?
Mainly in transportation (36% of U.S. consumption in 2025), packaging (24%), building (13%) and electrical uses (9%), according to the USGS.
Does Chile produce aluminum?
No. Chile has no primary aluminum smelters; the Alumysa project in Aysén was suspended in 2003.