The price of Brent crude, the benchmark used in Europe and in Chile, closed on Tuesday 17 November 2026 at US$92.94 a barrel, and US WTI at US$89.53, according to the spot prices released on 18 November by the US Energy Information Administration (EIA). That is 31% below the year's high of US$135.51 on 2 October.
Even so, crude is still expensive: so far in 2026 Brent averages US$96.34 a barrel, compared with US$69.14 for the whole of 2025. The reason is the war with Iran and disruptions to tanker traffic in the Persian Gulf. This guide explains what oil is worth today, how Brent differs from WTI, how the price has changed since 2000 and how it feeds through to petrol and diesel in Chile.
View the data as a table
| Brent, 17 November | US$92.94 a barrel |
| WTI, 17 November | US$89.53 a barrel |
| 2026 Brent high | US$135.51 |
| World oil demand in 2026 | -2.7 mb/d |
Oil price today: Brent and WTI
Oil does not have a single price. It is traded through benchmarks for crudes of different quality and delivery points. The two most used are Brent, a blend of North Sea crudes that serves as the reference for most of the crude traded around the world, and WTI (West Texas Intermediate), the light crude delivered at Cushing, Oklahoma, which sets prices in the United States. Both are quoted in dollars per barrel; a barrel holds 159 litres.
| Date (2026) | Brent (US$/barrel) | WTI (US$/barrel) |
|---|---|---|
| 17 November | 92.94 | 89.53 |
| 16 November | 92.90 | 89.24 |
| 13 November | 95.17 | 91.96 |
| 12 November | 95.42 | 92.30 |
| October average | 123.93 | 102.07 |
| September average | 114.16 | 97.31 |
| 2026 average (Jan-Oct) | 96.34 | 86.69 |
Source: EIA, Brent and WTI spot prices, released 18 November 2026. These are physical market prices at the close of each day; futures shown on financial websites can differ by a few dollars.
In 2026 Brent has been much more expensive than WTI: the average spread reaches US$9.65 a barrel, compared with less than US$4 in 2024 and 2025. Brent reflects seaborne crude and depends more on what happens in the Middle East, while WTI rests on output from the United States, the world's largest oil producer.
Why crude rose so much in 2026
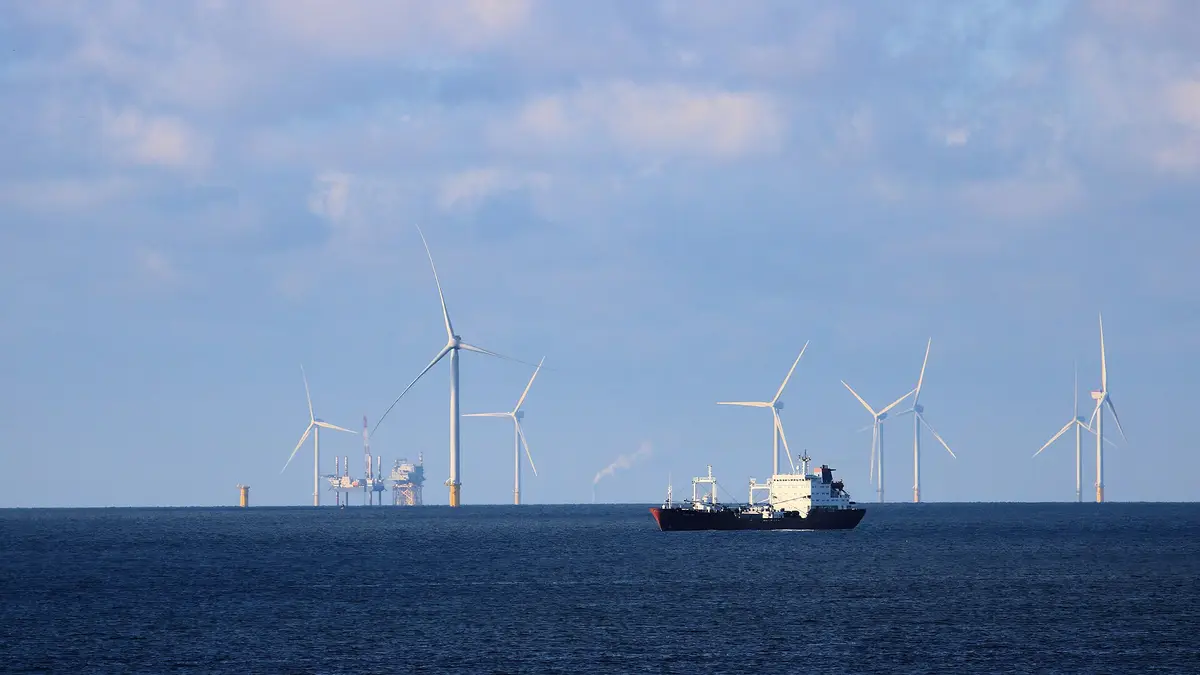
The year began with cheap oil: in January Brent averaged US$66.60. With the war with Iran and the closure or disruption of transit through the Strait of Hormuz, through which a large share of the Gulf's crude exports passes, the price jumped to US$103.13 in March and US$117.29 in April. It eased mid-year and spiked again in September when, according to the International Energy Agency (IEA), the Saudi East-West pipeline was bombed. In October it averaged US$123.93, the most expensive month since March 2012, with a daily high of US$135.51 on 2 October.
View the data as a table
| Brent | WTI | |
|---|---|---|
| Jan 24 | US$80.12 | US$74.15 |
| Feb 24 | US$83.48 | US$77.25 |
| Mar 24 | US$85.41 | US$81.28 |
| Apr 24 | US$89.94 | US$85.35 |
| May 24 | US$81.75 | US$80.02 |
| Jun 24 | US$82.25 | US$79.77 |
| Jul 24 | US$85.15 | US$81.80 |
| Aug 24 | US$80.36 | US$76.68 |
| Sep 24 | US$74.02 | US$70.24 |
| Oct 24 | US$75.63 | US$71.99 |
| Nov 24 | US$74.35 | US$69.95 |
| Dec 24 | US$73.86 | US$70.12 |
| Jan 25 | US$79.27 | US$75.74 |
| Feb 25 | US$75.44 | US$71.53 |
| Mar 25 | US$72.73 | US$68.24 |
| Apr 25 | US$68.13 | US$63.54 |
| May 25 | US$64.45 | US$62.17 |
| Jun 25 | US$71.44 | US$68.17 |
| Jul 25 | US$71.04 | US$68.39 |
| Aug 25 | US$67.87 | US$64.86 |
| Sep 25 | US$67.99 | US$63.96 |
| Oct 25 | US$64.54 | US$60.89 |
| Nov 25 | US$63.80 | US$60.06 |
| Dec 25 | US$62.54 | US$57.97 |
| Jan 26 | US$66.60 | US$60.04 |
| Feb 26 | US$70.89 | US$64.51 |
| Mar 26 | US$103.13 | US$91.38 |
| Apr 26 | US$117.29 | US$100.32 |
| May 26 | US$107.14 | US$102.13 |
| Jun 26 | US$85.40 | US$84.81 |
| Jul 26 | US$83.76 | US$80.46 |
| Aug 26 | US$91.08 | US$83.90 |
| Sep 26 | US$114.16 | US$97.31 |
| Oct 26 | US$123.93 | US$102.07 |
In November the price retreated. The IEA market report of 13 November says North Sea Dated crude was around US$93 a barrel, 32% below the US$136 high of early October, and that observed world inventories rose 52 million barrels in October, the first increase since June. But the agency warns that attacks on tankers and infrastructure continue and that maritime security is key to a sustained recovery.
High prices are destroying demand. The IEA projects that world oil consumption will fall by 2.7 million barrels a day in 2026, to 102.3 million, one of the largest drops in decades, and rebound by 2 million in 2027. Supply in 2026 would fall by 4.8 million barrels a day. Details of the previous report are in our story on the fall in world oil demand.
- Jan 2026Brent at US$66.60January average, the lowest of the year.
- Mar 2026Tops US$100US$103.13 average amid the war with Iran.
- Sep 2026Attack on the Saudi pipelineEast-West pipeline bombed, according to the IEA.
- 2 Oct 2026US$135.51Daily Brent spot high for 2026.
- 13 Nov 2026IEA reportDemand to fall 2.7 mb/d in 2026.
- 17 Nov 2026Brent at US$92.9431% below the October high.

Historical Brent oil price since 2000
In 2000 Brent averaged US$28.66 a barrel. It climbed with China's growth to US$96.94 in 2008, the year of the daily record of almost US$144, and after the financial crisis it stayed above US$100 between 2011 and 2013. The shale oil revolution in the United States pushed it down to US$43.64 in 2016, and the pandemic to US$41.96 in 2020. Russia's invasion of Ukraine took it back to US$100.93 in 2022, and by 2025 it had fallen to US$69.14.
| Year | Brent (US$/barrel) | WTI (US$/barrel) | What happened |
|---|---|---|---|
| 2026 (Jan-Oct) | 96.34 | 86.69 | War with Iran and Hormuz |
| 2025 | 69.14 | 65.39 | Oversupply |
| 2024 | 80.52 | 76.63 | — |
| 2022 | 100.93 | 94.90 | Russian invasion of Ukraine |
| 2020 | 41.96 | 39.16 | Pandemic |
| 2016 | 43.64 | 43.29 | US shale boom |
| 2012 | 111.63 | 94.05 | Highest annual average in the series |
| 2008 | 96.94 | 99.67 | Daily record and financial crisis |
| 2000 | 28.66 | 30.38 | — |
Source: EIA, annual averages of Brent and WTI spot prices (series released 18 November 2026). The “What happened” column summarises the context of each year.
| 2026 (Jan-Oct) | 96.34 | 86.69 | 9.65 |
| 2025 | 69.14 | 65.39 | 3.75 |
| 2024 | 80.52 | 76.63 | 3.89 |
| 2023 | 82.49 | 77.58 | 4.91 |
| 2022 | 100.93 | 94.90 | 6.03 |
| 2021 | 70.86 | 68.13 | 2.73 |
| 2020 | 41.96 | 39.16 | 2.80 |
| 2019 | 64.30 | 56.99 | 7.31 |
| 2018 | 71.34 | 65.23 | 6.11 |
| 2017 | 54.13 | 50.80 | 3.33 |
| 2016 | 43.64 | 43.29 | 0.35 |
| 2015 | 52.32 | 48.66 | 3.66 |
| 2014 | 98.97 | 93.17 | 5.80 |
| 2013 | 108.56 | 97.98 | 10.58 |
| 2012 | 111.63 | 94.05 | 17.58 |
| 2011 | 111.26 | 94.88 | 16.38 |
| 2010 | 79.61 | 79.48 | 0.13 |
| 2009 | 61.74 | 61.95 | -0.21 |
| 2008 | 96.94 | 99.67 | -2.73 |
| 2007 | 72.44 | 72.34 | 0.10 |
| 2006 | 65.16 | 66.05 | -0.89 |
| 2005 | 54.57 | 56.64 | -2.07 |
| 2004 | 38.26 | 41.51 | -3.25 |
| 2003 | 28.85 | 31.08 | -2.23 |
| 2002 | 24.99 | 26.18 | -1.19 |
| 2001 | 24.46 | 25.98 | -1.52 |
| 2000 | 28.66 | 30.38 | -1.72 |
Does your company manage fleets, sell fuel or electrify transport? Reach Energía Futura's readers.
See advertising optionsHow the oil price affects petrol in Chile
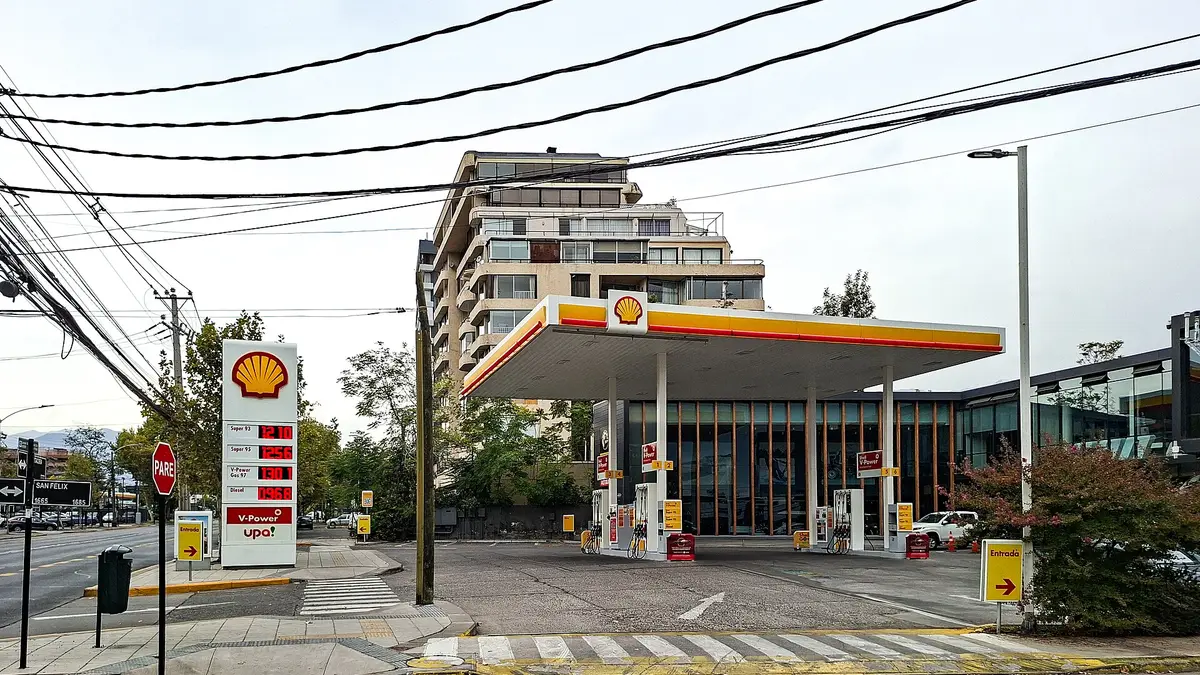
Chile imports almost all the oil and fuels it consumes. According to the report Estado de los Combustibles Fósiles en Chile by the Uno Punto Cinco Foundation, in 2025 the country spent US$12.295 billion importing fossil fuels, and the United States was the main supplier, with about US$5.3 billion, mostly diesel and other already refined products.
That is why the price of petrol does not follow the barrel of crude directly, but the international price of gasoline and diesel, which adds the refining margin. The chain has four steps:
- Import parity: state oil company Enap calculates its wholesale price every week using international gasoline and diesel benchmarks, plus freight, insurance and the exchange rate.
- Mepco: the Fuel Price Stabilisation Mechanism (Law 20,765) adjusts the variable component of the specific tax to smooth rises and falls.
- Specific tax: a fixed amount per cubic metre, of 6 UTM (a monthly tax unit) on gasoline and 1.5 UTM on diesel, plus VAT.
- Distribution: each service station sets its final price from the wholesale price, which is why it varies between districts and regions.
In 2026 that system led to a run of increases: between late July and 22 October diesel rose by 401.4 pesos per litre, as we reported in the story on the fifth consecutive fuel price rise. On 16 November Congress passed a law that puts ceilings on petrol and diesel prices until 7 April 2027, with cuts of about 40 and 140 pesos per litre from 19 November. Prices by region are in our guide to petrol prices in Chile.
What to expect for the barrel in 2027
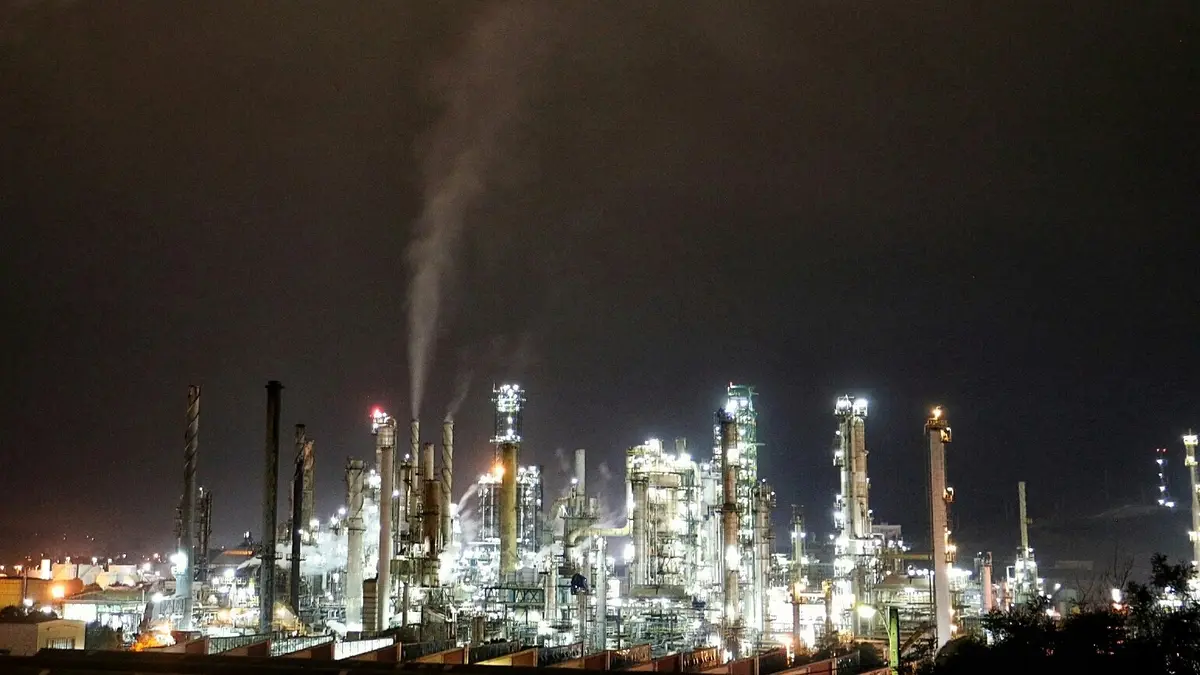
The IEA projects that world supply will rise by 6.6 million barrels a day in 2027, to 108.1 million, while demand would rebound by 2 million. Supply growing faster than consumption points to lower prices than in 2026, but the agency warns that maritime security is key to a sustained recovery. On-land inventories remain at their lowest since at least 2016, and observed world inventories have fallen by a cumulative 462 million barrels since the war began.
For Chile, cheaper oil will only translate into cheaper fuel after April 2027, when the law's ceilings end and Mepco resumes. Meanwhile, the rise in crude has improved the case for electric cars: with regulated electricity prices, the cost per kilometre of an electric car remains a fraction of that of a petrol car.
Frequently asked questions
What is the price of oil today?
On 17 November 2026 Brent closed at US$92.94 a barrel and WTI at US$89.53, according to the EIA.
What is the difference between Brent and WTI?
Brent is a blend of North Sea crudes and serves as the reference for most world trade; WTI is the US benchmark crude. In 2026 Brent has cost on average US$9.65 more per barrel.
How much did a barrel of oil cost in 2025?
Brent averaged US$69.14 and WTI US$65.39 in 2025, according to the EIA.
What was the highest oil price in 2026?
US$135.51 a barrel for Brent spot on 2 October 2026. October was the most expensive month, with an average of US$123.93.
How many litres are in a barrel of oil?
159 litres (42 US gallons).
Why doesn't petrol fall when oil falls?
Because prices in Chile follow international gasoline and diesel, not crude, and because Mepco spreads changes over time. In addition, the fuel law's ceilings apply until 7 April 2027.