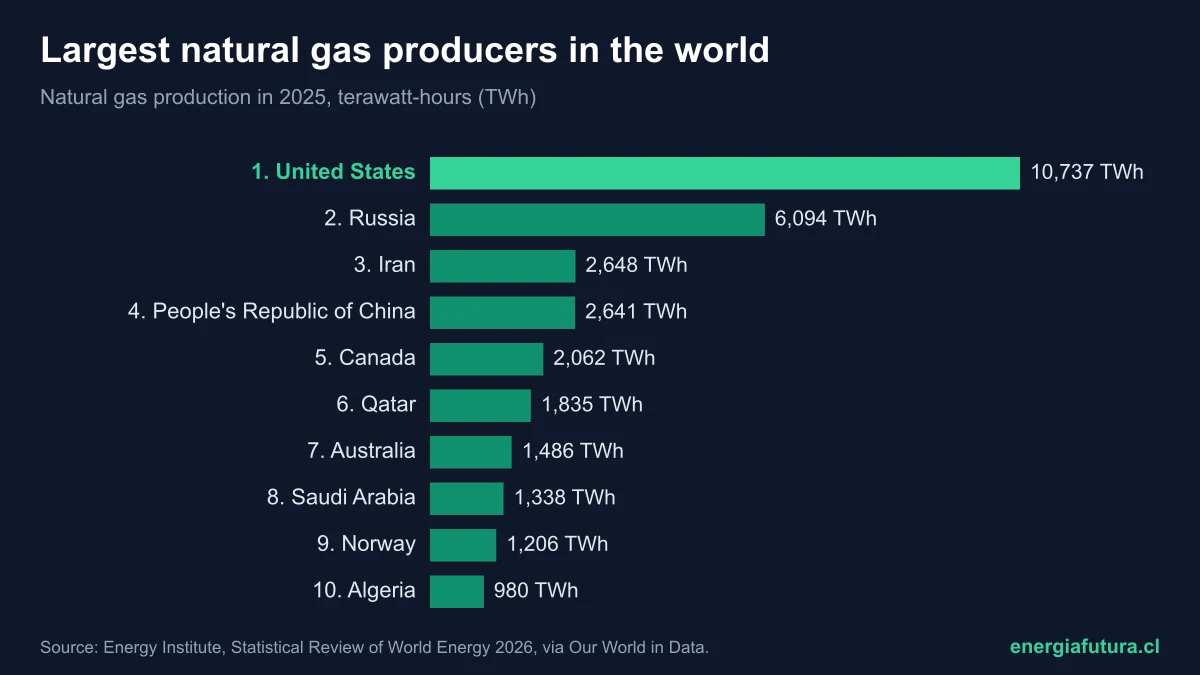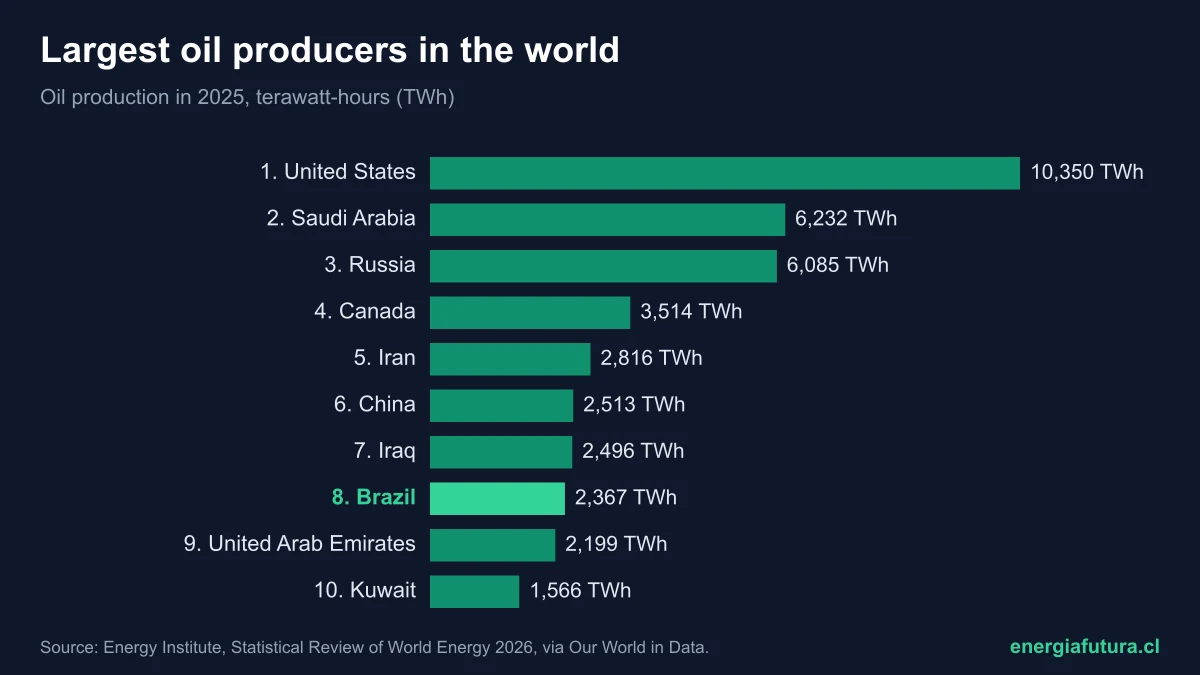
Updated on 17 November 2026. The United States is the world's largest oil producer: it produced 21.1 million barrels a day in 2025, almost as much as Saudi Arabia and Russia combined, according to the 2026 edition of the Energy Institute's Statistical Review of World Energy. Measured in energy, it produced 10,350 terawatt-hours (TWh), 18.9% of world output. It is followed by Saudi Arabia (11.4%), Russia (11.1%), Canada (6.4%) and Iran (5.2%). Brazil ranks eighth and is the largest producer in Latin America.
World oil production grew 3.5% in 2025 to about 100.6 million barrels a day, according to the Energy Institute. This ranking orders countries by their 2025 output (crude oil, condensates and natural gas liquids) using Energy Institute data processed by Our World in Data, and adds 2024 figures in barrels per day.
View the data as a table
| US barrels per day | 21.1 million |
| US share | 18.9% |
| World production | 100.6 M barrels/day |
| Brazil in the world ranking | N.º 8 |
Ranking of the largest oil producers in the world in 2025
| # | Country | 2025 output (TWh) | % of world | Change vs. 2024 | Barrels per day 2024 (thousands) |
|---|---|---|---|---|---|
| 1 | United States | 10,350 | 18.9% | +3.1% | 20,135 |
| 2 | Saudi Arabia | 6,232 | 11.4% | +5.0% | 10,856 |
| 3 | Russia | 6,085 | 11.1% | −0.6% | 10,752 |
| 4 | Canada | 3,514 | 6.4% | +4.1% | 5,888 |
| 5 | Iran | 2,816 | 5.2% | +2.2% | 5,062 |
| 6 | China | 2,513 | 4.6% | +1.5% | 4,264 |
| 7 | Iraq | 2,496 | 4.6% | +1.9% | 4,398 |
| 8 | Brazil | 2,367 | 4.3% | +12.0% | 3,466 |
| 9 | United Arab Emirates | 2,199 | 4.0% | +5.2% | 4,006 |
| 10 | Kuwait | 1,566 | 2.9% | +2.0% | 2,719 |
| 11 | Kazakhstan | 1,156 | 2.1% | +13.3% | 1,836 |
| 12 | Norway | 1,119 | 2.0% | +2.7% | 1,833 |
| 13 | Mexico | 1,040 | 1.9% | −7.2% | 1,911 |
| 14 | Nigeria | 977 | 1.8% | +6.5% | 1,641 |
| 15 | Qatar | 887 | 1.6% | +1.1% | 1,806 |
Source: Energy Institute, Statistical Review of World Energy 2026 (2025 output in TWh, via Our World in Data) and Statistical Review 2025 (2024 barrels per day). Includes crude, condensates and natural gas liquids.
View the data as a table
| TWh | |
|---|---|
| United States | 10,350 TWh |
| Saudi Arabia | 6,232 TWh |
| Russia | 6,085 TWh |
| Canada | 3,514 TWh |
| Iran | 2,816 TWh |
| People's Republic of China | 2,513 TWh |
| Iraq | 2,496 TWh |
| Brazil | 2,367 TWh |
| United Arab Emirates | 2,199 TWh |
| Kuwait | 1,566 TWh |
| Kazakhstan | 1,156 TWh |
| Norway | 1,119 TWh |
| Mexico | 1,040 TWh |
| Nigeria | 977 TWh |
| Qatar | 887 TWh |
| Argentina | 802 TWh |
| Libya | 768 TWh |
| Algeria | 761 TWh |
| Venezuela | 666 TWh |
| Angola | 617 TWh |
| Oman | 560 TWh |
| Colombia | 459 TWh |
| Guyana | 415 TWh |
| India | 371 TWh |
| United Kingdom | 363 TWh |
| Indonesia | 348 TWh |
| Azerbaijan | 323 TWh |
| Egypt | 308 TWh |
| Malaysia | 284 TWh |
| Ecuador | 275 TWh |
| Republic of the Congo | 166 TWh |
| Australia | 160 TWh |
| Thailand | 156 TWh |
| Gabon | 132 TWh |
| Turkmenistan | 106 TWh |
| Vietnam | 99 TWh |
| South Sudan | 76 TWh |
| Chad | 68 TWh |
| Brunei Darussalam | 61 TWh |
| Peru | 58 TWh |
| Italy | 45 TWh |
| Denmark | 41 TWh |
| Equatorial Guinea | 41 TWh |
| Trinidad and Tobago | 37 TWh |
| Romania | 31 TWh |
| Uzbekistan | 21 TWh |
| Syrian Arab Republic | 19 TWh |
| Tunisia | 15 TWh |
| Sudan | 15 TWh |
| Yemen | 12 TWh |
| 1 | United States | 10,350 | 18.9% | 3.1% |
| 2 | Saudi Arabia | 6,232 | 11.4% | 5.0% |
| 3 | Russia | 6,085 | 11.1% | -0.6% |
| 4 | Canada | 3,514 | 6.4% | 4.1% |
| 5 | Iran | 2,816 | 5.2% | 2.2% |
| 6 | People's Republic of China | 2,513 | 4.6% | 1.5% |
| 7 | Iraq | 2,496 | 4.6% | 1.9% |
| 8 | Brazil | 2,367 | 4.3% | 12.0% |
| 9 | United Arab Emirates | 2,199 | 4.0% | 5.2% |
| 10 | Kuwait | 1,566 | 2.9% | 2.0% |
| 11 | Kazakhstan | 1,156 | 2.1% | 13.2% |
| 12 | Norway | 1,119 | 2.0% | 2.7% |
| 13 | Mexico | 1,040 | 1.9% | -7.2% |
| 14 | Nigeria | 977 | 1.8% | 6.5% |
| 15 | Qatar | 887 | 1.6% | 1.1% |
| 16 | Argentina | 802 | 1.5% | 17.4% |
| 17 | Libya | 768 | 1.4% | 18.6% |
| 18 | Algeria | 761 | 1.4% | 2.9% |
| 19 | Venezuela | 666 | 1.2% | 13.1% |
| 20 | Angola | 617 | 1.1% | -7.9% |
| 21 | Oman | 560 | 1.0% | 0.4% |
| 22 | Colombia | 459 | 0.8% | -3.4% |
| 23 | Guyana | 415 | 0.8% | 15.9% |
| 24 | India | 371 | 0.7% | -1.6% |
| 25 | United Kingdom | 363 | 0.7% | 2.6% |
| 26 | Indonesia | 348 | 0.6% | 0.2% |
| 27 | Azerbaijan | 323 | 0.6% | -4.7% |
| 28 | Egypt | 308 | 0.6% | -6.8% |
| 29 | Malaysia | 284 | 0.5% | -0.4% |
| 30 | Ecuador | 275 | 0.5% | -7.5% |
| 31 | Republic of the Congo | 166 | 0.3% | 3.8% |
| 32 | Australia | 160 | 0.3% | -8.9% |
| 33 | Thailand | 156 | 0.3% | 8.0% |
| 34 | Gabon | 132 | 0.2% | 1.2% |
| 35 | Turkmenistan | 106 | 0.2% | 1.1% |
| 36 | Vietnam | 99 | 0.2% | 0.5% |
| 37 | South Sudan | 76 | 0.1% | 53.0% |
| 38 | Chad | 68 | 0.1% | -13.5% |
| 39 | Brunei Darussalam | 61 | 0.1% | 8.0% |
| 40 | Peru | 58 | 0.1% | 1.9% |
| 41 | Italy | 45 | 0.1% | -13.0% |
| 42 | Denmark | 41 | 0.1% | 19.6% |
| 43 | Equatorial Guinea | 41 | 0.1% | -19.2% |
| 44 | Trinidad and Tobago | 37 | 0.1% | 5.8% |
| 45 | Romania | 31 | 0.1% | -7.3% |
| 46 | Uzbekistan | 21 | 0.0% | -6.9% |
| 47 | Syria | 19 | 0.0% | -2.5% |
| 48 | Tunisia | 15 | 0.0% | -10.5% |
| 49 | Sudan | 15 | 0.0% | -31.1% |
| 50 | Yemen | 12 | 0.0% | -47.4% |
How the United States became the largest oil producer
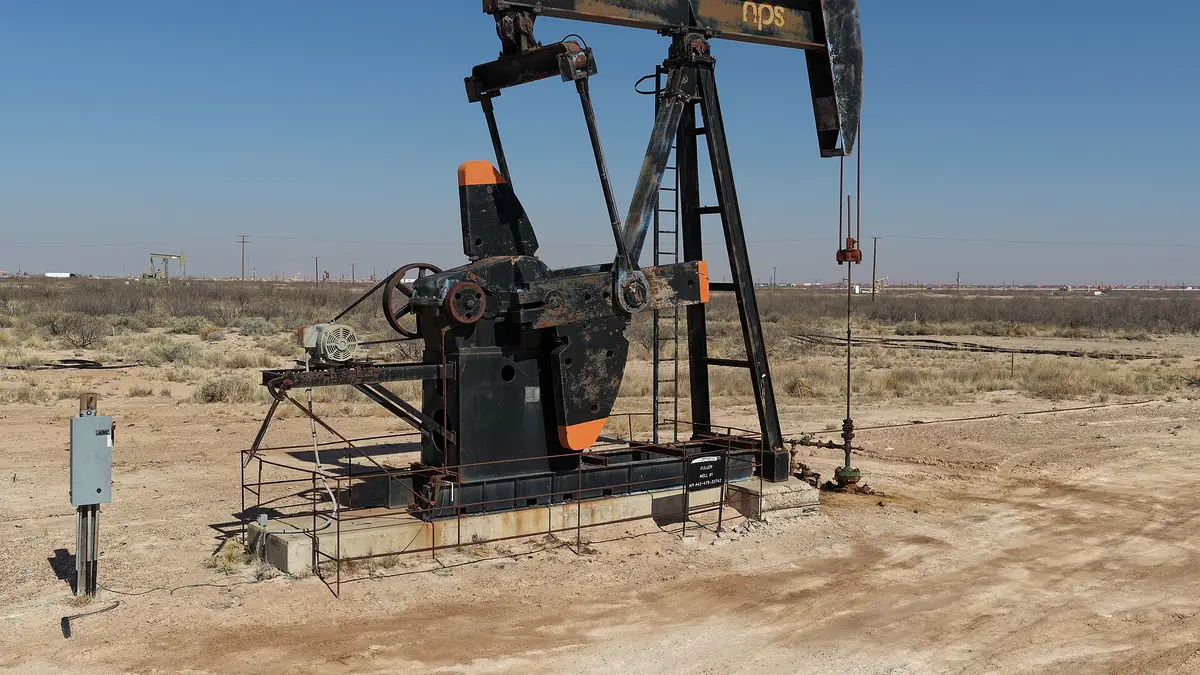
In 2000, the United States produced 4,042 TWh of oil and trailed Saudi Arabia (5,100 TWh). The shale oil revolution, using horizontal drilling and hydraulic fracturing in basins such as the Permian in Texas and New Mexico, changed the order: US output doubled between 2010 and 2018 and the country has topped the ranking since 2017. In 2025 it reached 10,350 TWh, 2.6 times its 2000 level.
Saudi Arabia and Russia, by contrast, move within a narrow band, partly because they adjust output under OPEC+ agreements. Saudi Arabia rose 5% in 2025 as those cuts eased, while Russia fell 0.6%.
The other big winner of the century is Canada, fourth in the ranking: it went from 1,455 TWh in 2000 to 3,514 TWh in 2025, 2.4 times more, thanks to Alberta's oil sands, a heavy oil whose extraction uses a lot of energy and water. Together with the United States, Canada accounts for much of the increase in world oil supply over the past fifteen years.
View the data as a table
| 2000 | 2001 | 2002 | 2003 | 2004 | 2005 | 2006 | 2007 | 2008 | 2009 | 2010 | 2011 | 2012 | 2013 | 2014 | 2015 | 2016 | 2017 | 2018 | 2019 | 2020 | 2021 | 2022 | 2023 | 2024 | 2025 | |
|---|---|---|---|---|---|---|---|---|---|---|---|---|---|---|---|---|---|---|---|---|---|---|---|---|---|---|
| Saudi Arabia | 5,100 TWh | 4,974 TWh | 4,536 TWh | 5,356 TWh | 5,731 TWh | 6,008 TWh | 5,919 TWh | 5,686 TWh | 5,931 TWh | 5,338 TWh | 5,388 TWh | 6,079 TWh | 6,387 TWh | 6,262 TWh | 6,325 TWh | 6,606 TWh | 6,823 TWh | 6,505 TWh | 6,708 TWh | 6,473 TWh | 6,043 TWh | 5,990 TWh | 6,666 TWh | 6,151 TWh | 5,933 TWh | 6,232 TWh |
| United States | 4,042 TWh | 4,007 TWh | 3,976 TWh | 3,868 TWh | 3,784 TWh | 3,594 TWh | 3,541 TWh | 3,547 TWh | 3,515 TWh | 3,752 TWh | 3,874 TWh | 4,029 TWh | 4,597 TWh | 5,217 TWh | 6,096 TWh | 6,591 TWh | 6,315 TWh | 6,680 TWh | 7,788 TWh | 8,736 TWh | 8,306 TWh | 8,351 TWh | 8,917 TWh | 9,653 TWh | 10,036 TWh | 10,350 TWh |
| Russia | 3,799 TWh | 4,090 TWh | 4,462 TWh | 4,951 TWh | 5,388 TWh | 5,522 TWh | 5,655 TWh | 5,784 TWh | 5,748 TWh | 5,831 TWh | 5,958 TWh | 6,041 TWh | 6,126 TWh | 6,190 TWh | 6,250 TWh | 6,333 TWh | 6,495 TWh | 6,496 TWh | 6,605 TWh | 6,669 TWh | 6,098 TWh | 6,266 TWh | 6,379 TWh | 6,299 TWh | 6,124 TWh | 6,085 TWh |
| Iran | 2,229 TWh | 2,207 TWh | 2,083 TWh | 2,350 TWh | 2,429 TWh | 2,418 TWh | 2,450 TWh | 2,480 TWh | 2,505 TWh | 2,410 TWh | 2,466 TWh | 2,472 TWh | 2,099 TWh | 1,973 TWh | 2,024 TWh | 2,096 TWh | 2,514 TWh | 2,728 TWh | 2,599 TWh | 1,912 TWh | 1,742 TWh | 2,026 TWh | 2,132 TWh | 2,511 TWh | 2,754 TWh | 2,816 TWh |
| Mexico | 1,981 TWh | 2,045 TWh | 2,068 TWh | 2,189 TWh | 2,210 TWh | 2,169 TWh | 2,123 TWh | 2,003 TWh | 1,825 TWh | 1,706 TWh | 1,693 TWh | 1,681 TWh | 1,673 TWh | 1,650 TWh | 1,594 TWh | 1,483 TWh | 1,411 TWh | 1,273 TWh | 1,190 TWh | 1,104 TWh | 1,105 TWh | 1,122 TWh | 1,135 TWh | 1,192 TWh | 1,121 TWh | 1,040 TWh |
| People's Republic of China | 1,891 TWh | 1,917 TWh | 1,941 TWh | 1,972 TWh | 2,024 TWh | 2,109 TWh | 2,149 TWh | 2,167 TWh | 2,215 TWh | 2,204 TWh | 2,361 TWh | 2,359 TWh | 2,413 TWh | 2,442 TWh | 2,459 TWh | 2,495 TWh | 2,322 TWh | 2,227 TWh | 2,202 TWh | 2,229 TWh | 2,265 TWh | 2,313 TWh | 2,381 TWh | 2,431 TWh | 2,476 TWh | 2,513 TWh |
| Norway | 1,872 TWh | 1,881 TWh | 1,830 TWh | 1,784 TWh | 1,747 TWh | 1,610 TWh | 1,499 TWh | 1,377 TWh | 1,331 TWh | 1,260 TWh | 1,147 TWh | 1,086 TWh | 1,012 TWh | 964 TWh | 988 TWh | 1,019 TWh | 1,050 TWh | 1,034 TWh | 969 TWh | 915 TWh | 1,071 TWh | 1,092 TWh | 1,035 TWh | 1,101 TWh | 1,090 TWh | 1,119 TWh |
| Venezuela | 1,864 TWh | 1,896 TWh | 1,776 TWh | 1,715 TWh | 1,979 TWh | 1,970 TWh | 1,990 TWh | 1,928 TWh | 1,929 TWh | 1,813 TWh | 1,696 TWh | 1,646 TWh | 1,620 TWh | 1,602 TWh | 1,611 TWh | 1,717 TWh | 1,542 TWh | 1,321 TWh | 980 TWh | 608 TWh | 391 TWh | 385 TWh | 467 TWh | 520 TWh | 589 TWh | 666 TWh |
| Iraq | 1,498 TWh | 1,441 TWh | 1,208 TWh | 768 TWh | 1,162 TWh | 1,046 TWh | 1,140 TWh | 1,222 TWh | 1,388 TWh | 1,393 TWh | 1,405 TWh | 1,579 TWh | 1,760 TWh | 1,767 TWh | 1,847 TWh | 2,275 TWh | 2,531 TWh | 2,586 TWh | 2,640 TWh | 2,724 TWh | 2,350 TWh | 2,336 TWh | 2,574 TWh | 2,478 TWh | 2,450 TWh | 2,496 TWh |
| United Kingdom | 1,468 TWh | 1,357 TWh | 1,348 TWh | 1,234 TWh | 1,109 TWh | 985 TWh | 891 TWh | 891 TWh | 835 TWh | 793 TWh | 732 TWh | 604 TWh | 518 TWh | 473 TWh | 464 TWh | 527 TWh | 552 TWh | 542 TWh | 592 TWh | 603 TWh | 570 TWh | 475 TWh | 439 TWh | 389 TWh | 353 TWh | 363 TWh |
| Canada | 1,455 TWh | 1,467 TWh | 1,547 TWh | 1,636 TWh | 1,688 TWh | 1,659 TWh | 1,756 TWh | 1,810 TWh | 1,782 TWh | 1,781 TWh | 1,868 TWh | 1,979 TWh | 2,127 TWh | 2,273 TWh | 2,440 TWh | 2,513 TWh | 2,545 TWh | 2,752 TWh | 2,998 TWh | 3,064 TWh | 2,930 TWh | 3,101 TWh | 3,186 TWh | 3,230 TWh | 3,375 TWh | 3,514 TWh |
| United Arab Emirates | 1,413 TWh | 1,377 TWh | 1,268 TWh | 1,468 TWh | 1,527 TWh | 1,588 TWh | 1,694 TWh | 1,671 TWh | 1,689 TWh | 1,498 TWh | 1,561 TWh | 1,737 TWh | 1,802 TWh | 1,880 TWh | 1,895 TWh | 2,036 TWh | 2,112 TWh | 2,034 TWh | 2,046 TWh | 2,092 TWh | 1,941 TWh | 1,930 TWh | 2,157 TWh | 2,096 TWh | 2,090 TWh | 2,199 TWh |
| Kuwait | 1,278 TWh | 1,239 TWh | 1,149 TWh | 1,344 TWh | 1,434 TWh | 1,517 TWh | 1,556 TWh | 1,512 TWh | 1,584 TWh | 1,408 TWh | 1,435 TWh | 1,639 TWh | 1,791 TWh | 1,761 TWh | 1,747 TWh | 1,724 TWh | 1,776 TWh | 1,686 TWh | 1,708 TWh | 1,668 TWh | 1,526 TWh | 1,512 TWh | 1,692 TWh | 1,622 TWh | 1,535 TWh | 1,566 TWh |
| Brazil | 780 TWh | 817 TWh | 914 TWh | 948 TWh | 941 TWh | 1,035 TWh | 1,094 TWh | 1,109 TWh | 1,153 TWh | 1,233 TWh | 1,298 TWh | 1,326 TWh | 1,307 TWh | 1,281 TWh | 1,424 TWh | 1,537 TWh | 1,590 TWh | 1,659 TWh | 1,635 TWh | 1,758 TWh | 1,853 TWh | 1,825 TWh | 1,898 TWh | 2,135 TWh | 2,113 TWh | 2,367 TWh |
View the data as a table
| United States | Saudi Arabia | Russia | Canada | Brazil | |
|---|---|---|---|---|---|
| 2000 | 4,042 | 5,100 | 3,799 | 1,455 | 780 |
| 2001 | 4,007 | 4,974 | 4,090 | 1,467 | 817 |
| 2002 | 3,976 | 4,536 | 4,462 | 1,547 | 914 |
| 2003 | 3,868 | 5,356 | 4,951 | 1,636 | 948 |
| 2004 | 3,784 | 5,731 | 5,388 | 1,688 | 941 |
| 2005 | 3,594 | 6,008 | 5,522 | 1,659 | 1,035 |
| 2006 | 3,541 | 5,919 | 5,655 | 1,756 | 1,094 |
| 2007 | 3,547 | 5,686 | 5,784 | 1,810 | 1,109 |
| 2008 | 3,515 | 5,931 | 5,748 | 1,782 | 1,153 |
| 2009 | 3,752 | 5,338 | 5,831 | 1,781 | 1,233 |
| 2010 | 3,874 | 5,388 | 5,958 | 1,868 | 1,298 |
| 2011 | 4,029 | 6,079 | 6,041 | 1,979 | 1,326 |
| 2012 | 4,597 | 6,387 | 6,126 | 2,127 | 1,307 |
| 2013 | 5,217 | 6,262 | 6,190 | 2,273 | 1,281 |
| 2014 | 6,096 | 6,325 | 6,250 | 2,440 | 1,424 |
| 2015 | 6,591 | 6,606 | 6,333 | 2,513 | 1,537 |
| 2016 | 6,315 | 6,823 | 6,495 | 2,545 | 1,590 |
| 2017 | 6,680 | 6,505 | 6,496 | 2,752 | 1,659 |
| 2018 | 7,788 | 6,708 | 6,605 | 2,998 | 1,635 |
| 2019 | 8,736 | 6,473 | 6,669 | 3,064 | 1,758 |
| 2020 | 8,306 | 6,043 | 6,098 | 2,930 | 1,853 |
| 2021 | 8,351 | 5,990 | 6,266 | 3,101 | 1,825 |
| 2022 | 8,917 | 6,666 | 6,379 | 3,186 | 1,898 |
| 2023 | 9,653 | 6,151 | 6,299 | 3,230 | 2,135 |
| 2024 | 10,036 | 5,933 | 6,124 | 3,375 | 2,113 |
| 2025 | 10,350 | 6,232 | 6,085 | 3,514 | 2,367 |
Oil production by region and OPEC's share
The Middle East remains the largest oil-producing region: 16,903 TWh in 2025, 30.9% of the world total, with Saudi Arabia, Iraq, Iran, the UAE and Kuwait. But North America (United States, Canada and Mexico) has closed in, with 14,904 TWh (27.3%), and is the region that has grown most over the past decade: 41% since 2015, while the Middle East rose 3%.
OPEC countries produced 18,819 TWh in 2025, 34.4% of the world, slightly less than in 2015 (19,094 TWh), according to the Energy Institute. South and Central America was the fastest-growing region in 2025, up 10%, thanks to Brazil, Argentina and Guyana. Europe, by contrast, produces just 3.3%, mostly in Norway and the United Kingdom.
| Region | 2025 output (TWh) | % of world | Change vs. 2024 | 2015 output (TWh) |
|---|---|---|---|---|
| Middle East | 16,903 | 30.9% | +3.3% | 16,357 |
| North America | 14,904 | 27.3% | +2.6% | 10,587 |
| CIS (Russia and neighbours) | 7,717 | 14.1% | +1.1% | 7,948 |
| South and Central America | 5,130 | 9.4% | +10.0% | 4,776 |
| Africa | 4,172 | 7.6% | +3.9% | 4,482 |
| Asia Pacific | 4,063 | 7.4% | +0.7% | 4,653 |
| Europe | 1,784 | 3.3% | +2.8% | 1,937 |
| World | 54,674 | 100% | +3.2% | 50,739 |
Source: Energy Institute, Statistical Review of World Energy 2026, via Our World in Data. Regions are those of the Energy Institute; the CIS groups Russia, Kazakhstan, Azerbaijan and other former Soviet countries. Measured in energy, world output grew 3.2% in 2025; in barrels, 3.5%.
The largest oil producers in Latin America
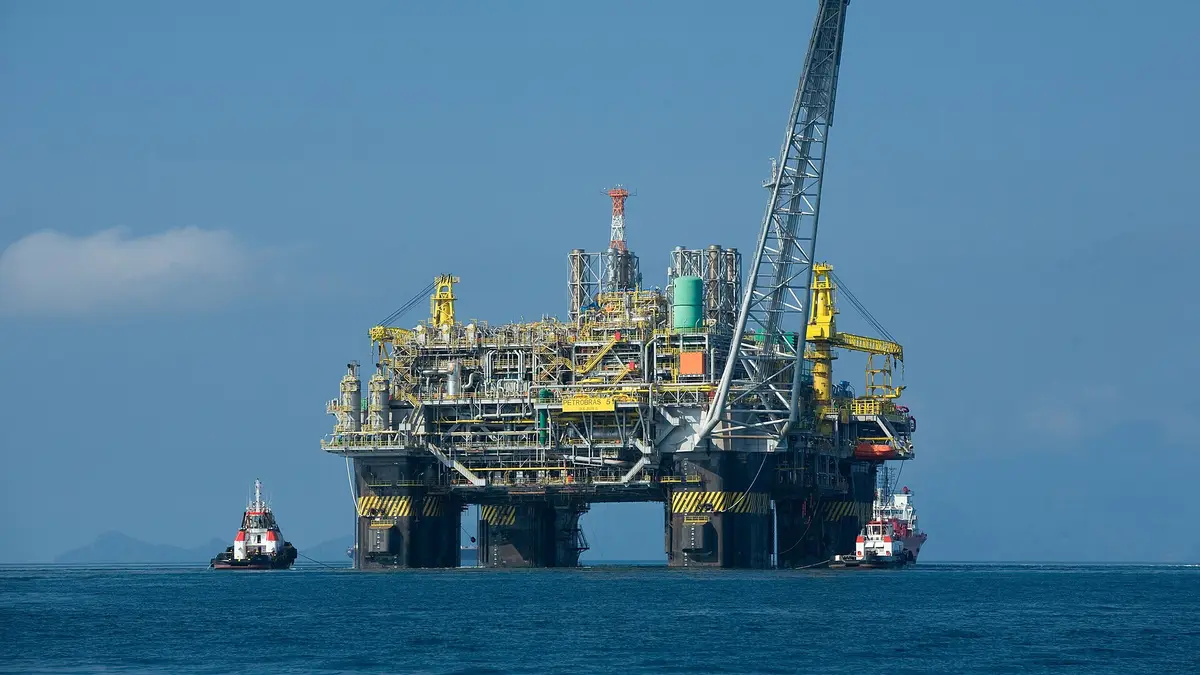
Brazil is Latin America's largest oil producer and the eighth in the world, with 2,367 TWh in 2025, 12% more than in 2024, thanks to its offshore pre-salt fields. It is followed by Mexico (1,040 TWh, 13th in the world), in decline for two decades and down 7.2% in 2025; Argentina (801 TWh, 16th), up 17.4% on the back of Vaca Muerta; Venezuela (666 TWh, 19th), up 13.1% but producing a third of its 2000 output; and Colombia (459 TWh, 22nd).
The most striking case is Guyana: it produced no oil until 2019 and in 2025 reached 415 TWh, 23rd in the world, up 15.9%. Ecuador ranks 30th, with 275 TWh; that is where Chile's state oil company Enap invests, having bought Pluspetrol Ecuador for US$207 million. Chile does not appear in the ranking: its output, concentrated in Magallanes, is very small, and the country imports almost all the oil it consumes.
View the data as a table
| TWh | |
|---|---|
| Brazil | 2,367 TWh · World rank 8 |
| Mexico | 1,040 TWh · World rank 13 |
| Argentina | 802 TWh · World rank 16 |
| Venezuela | 666 TWh · World rank 19 |
| Colombia | 459 TWh · World rank 22 |
| Guyana | 415 TWh · World rank 23 |
| Ecuador | 275 TWh · World rank 30 |
| Peru | 58 TWh · World rank 40 |
| Trinidad and Tobago | 37 TWh · World rank 44 |
| Country | World rank | 2025 output (TWh) | Change vs. 2024 | Barrels per day 2024 (thousands) |
|---|---|---|---|---|
| Brazil | 8 | 2,367 | +12.0% | 3,466 |
| Mexico | 13 | 1,040 | −7.2% | 1,911 |
| Argentina | 16 | 801 | +17.4% | 1,214 |
| Venezuela | 19 | 666 | +13.1% | 960 |
| Colombia | 22 | 459 | −3.4% | 773 |
| Guyana | 23 | 415 | +15.9% | 616 |
| Ecuador | 30 | 275 | −7.5% | 475 |
Source: Energy Institute, Statistical Review of World Energy 2026 and 2025, via Our World in Data. Peru (40th) and Trinidad and Tobago (44th) complete the region's producers with data.
Does your company work in the energy transition, fuels or e-mobility? Reach Energía Futura's readers.
See advertising optionsWhat the oil producer ranking means for the energy transition
Oil is still the world's largest energy source and production hit a record in 2025. At the same time, the International Energy Agency projects that demand growth is slowing because of electric cars and efficiency, as we reported in our story on world oil demand in 2026.
For Chile, which imports almost all its oil, the ranking matters through prices: what the big producers decide shows up in the cost of petrol and diesel. Our guide to petrol prices in Latin America compares what each country pays per litre.
Methodology
2025 output in TWh is as published by Our World in Data from the Energy Institute's Statistical Review of World Energy 2026, which covers crude oil, condensates and natural gas liquids and is supplemented with US EIA data for countries not covered. Regional aggregates are excluded. Barrels-per-day figures are for 2024, from the full Statistical Review 2025 database, because the 2026 edition's country data in barrels had not been published at the time of writing. The US figure of 21.1 million barrels a day in 2025 comes from the 2026 edition's summary. Data downloaded on 17 November 2026.
How to cite this data
Energía Futura (2026). "Largest oil-producing countries in the world 2026: country ranking and Latin America". Updated on 17 November 2026. energiafutura.cl/en/news/largest-oil-producing-countries-in-the-world-2026-ranking-and-latin-america. Data: Energy Institute (2026), Statistical Review of World Energy.
Frequently asked questions
Which country is the largest oil producer in the world?
The United States, with 21.1 million barrels a day in 2025, 18.9% of world production measured in energy, according to the Energy Institute.
Who are the top 5 oil producers?
The United States, Saudi Arabia, Russia, Canada and Iran, in that order, in 2025.
Which is Latin America's largest oil producer?
Brazil, eighth in the world, with 2,367 TWh in 2025 and about 3.5 million barrels a day in 2024.
Since when has the United States been number one?
Since 2017, when it overtook Saudi Arabia and Russia thanks to shale oil, according to the Energy Institute series on Our World in Data.
Does Chile produce oil?
Very little, in the Magallanes region, through Enap. It does not appear in the Energy Institute ranking and depends on imports.
Which country increased its output the most in 2025?
Among the large producers, Libya (+18.6%), Argentina (+17.4%), Guyana (+15.9%), Kazakhstan (+13.3%), Venezuela (+13.1%) and Brazil (+12%).