Some 31.9% of the transmission works for grid upgrades tendered in the latest period were declared void because every bid exceeded the maximum value, compared with 20.4% in the previous period. In addition, 65% of the 144 works whose progress Chile's National Electricity Coordinator tracks are running late. These are two of the conclusions of the Half-yearly Competition Monitoring Report published by the Coordinator's Competition Monitoring Unit (UMC) in November 2026.
The report also confirms the shift in the power mix: by June 2026 installed capacity reached about 40.7 GW, solar has overtaken thermal, and battery capacity rose from 2.6 GW in January to 5 GW in June. For transmission, the UMC proposes updating the reference values of works, indexing contracts and studying auctions to allocate grid connection capacity.
View the data as a table
| Expansion works on record | 518 |
| Upgrade works void over price cap | 31.9% |
| Works running late | 65% |
| Batteries on the grid | 5 GW |
What is happening with transmission works
As of 4 August 2026 there were 518 transmission expansion works on record. Of these, 466 had been tendered at least once and 93 were still in process. Among the 373 works with completed processes, 332 had been awarded.
| Transmission expansion works (as of 4 August 2026) | Number |
|---|---|
| Works on record | 518 |
| Tendered at least once | 466 |
| Still in tender | 93 |
| With completed processes | 373 |
| Awarded | 332 |
| Tendered in more than one process | 148 (32%) |
Source: National Electricity Coordinator, Half-yearly Competition Monitoring Report, November 2026. The works with the most calls, six each, were the expansion at the Río Blanco substation and the capacity increase on the 1x66 kV El Maitén-El Paico-El Monte line.
The UMC analysed upgrade works in detail; since Law 21,721 these are tendered by the owners of the facilities rather than by the Coordinator. It compared a previous period, with 108 works, and the current one, with 51 works tendered and 47 with results. Competition improved: the average number of bids per work receiving bids rose from 1.59 to 2.05, and works with three or more bids went from 10.1% to 25.5%. But fewer works ended up awarded.
View the data as a table
| Awarded | Void: above maximum value | No bids | Disqualified | |
|---|---|---|---|---|
| Previous period (108 works) | 47.2% | 20.4% | 24.1% | 8.3% |
| Current period (47 works with results) | 42.6% | 31.9% | 19.1% | 6.4% |
| Works tendered | 108 | 51 |
| Financial bids | 108 | 76 |
| Average bids per work (with bids) | 1.59 | 2.05 |
| Awarded value / reference value (average) | 2.15 times | 2.54 times |
| Works awarded | 47.2% | 42.6% |
| Void: above maximum value | 20.4% | 31.9% |
| Void: no bids | 24.1% | 19.1% |
| Works with three or more bids | 10.1% | 25.5% |
The reason lies in prices. Awarded bids were, at the median, more than twice the reference value of each work (2.06 and 2.16 times in each period), and the median of all bids rose from 2.46 to 2.94 times. For the UMC, reference values do not reflect current costs of materials, equipment, exchange rates and labour. Among works that were re-tendered, the maximum value was revised upwards in 48 of 56 cases.
By company, CGE accounted for 20 of the 51 works tendered and 14 of the 27 declared void, although the UMC notes it was also the owner with the most works in the period. In the portfolios of Saesa and Transelec, seven of nine and four of five works were awarded, respectively.
Does your company build, operate or finance transmission works or batteries? Reach Energía Futura's readers.
See advertising optionsDelays in transmission works and eight stalled projects
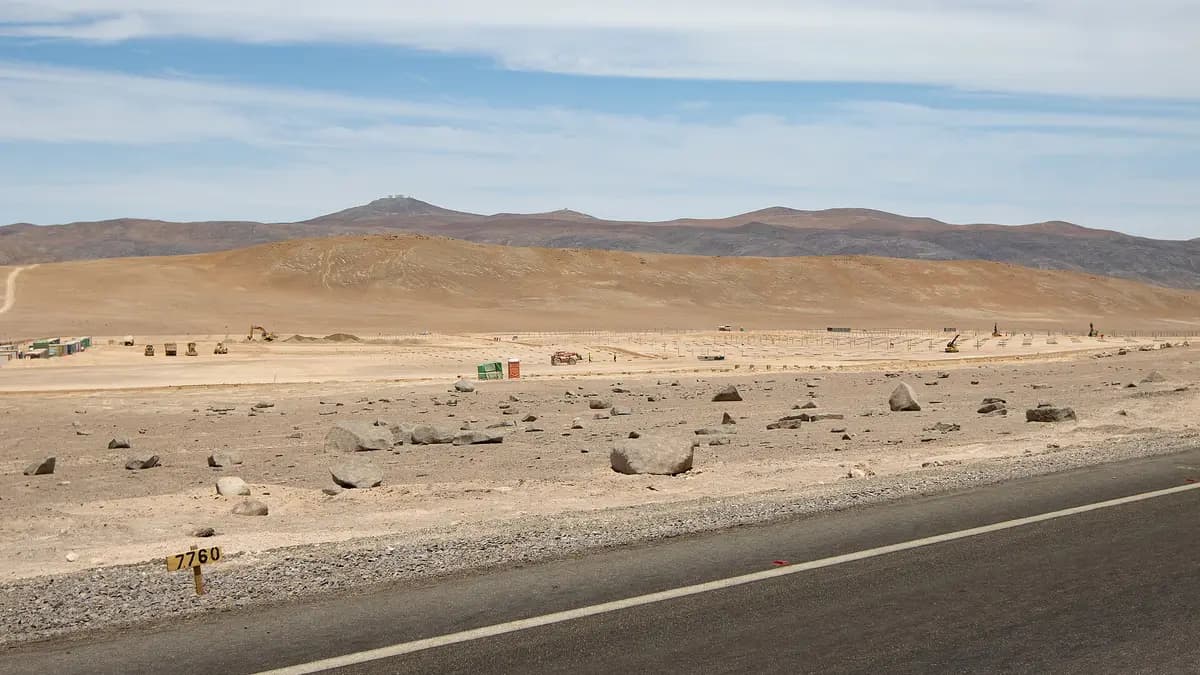
As of September, 65% of the 144 works being tracked were delayed to varying degrees, and more than 27% of 500 kV lines failed to meet at least one outage-duration index. The report also identifies eight stalled upgrade works, including the capacity increase on the 2x500 kV Alto Jahuel-Lo Aguirre line and on the 2x220 kV Ciruelos-Cautín line, both owned by Transelec.
Delays matter because they increase congestion, renewable curtailment and operating costs. In zonal networks they can also hold back the connection of new demand, a problem the Coordinator had already flagged in its zonal transmission diagnosis.
The UMC's proposals
- Update the reference investment values of works that are re-tendered, using current costs.
- Index the value between award and completion of the work, based on materials, exchange rate and labour.
- Set reserve values using costs available at the time of award, and consider letting owners build lower-value works directly.
- Measure transmission performance by its effects on congestion, marginal-cost decoupling and curtailment.
- Change how open access is allocated: instead of first-come first-served, periodic calls and auctions when requests exceed a node's capacity. The proceeds could fund transmission.
The UMC also repeats two recommendations it sent to the CNE on 1 April: moving from pay as bid to pay as clear in frequency-control auctions and changing the treatment of side payments. The tender proposals add to those the Coordinator presented in October on competition in the electricity sector.
Solar overtakes thermal and batteries double
In the first half, solar's share of installed capacity rose from 31.7% to 33.5%, overtaking thermal, which fell from 32.6% to 30.7%. Solar and wind together account for 50.5% of capacity, up from 47.9% in December 2025. Total capacity grew 4.3% in the half and 7.9% over twelve months.
View the data as a table
| Solar | Thermal | Hydro | Wind | |
|---|---|---|---|---|
| Jan-25 | 11.3 GW | 12.5 GW | 7.6 GW | 5.3 GW |
| Feb-25 | 11.4 GW | 12.5 GW | 7.6 GW | 5.3 GW |
| Mar-25 | 11.7 GW | 12.5 GW | 7.6 GW | 5.5 GW |
| Apr-25 | 11.7 GW | 12.5 GW | 7.6 GW | 5.6 GW |
| May-25 | 11.7 GW | 12.5 GW | 7.6 GW | 5.6 GW |
| Jun-25 | 11.8 GW | 12.5 GW | 7.6 GW | 5.8 GW |
| Jul-25 | 11.8 GW | 12.5 GW | 7.6 GW | 5.8 GW |
| Aug-25 | 11.9 GW | 12.5 GW | 7.6 GW | 6.2 GW |
| Sep-25 | 12.1 GW | 12.5 GW | 7.6 GW | 6.3 GW |
| Oct-25 | 12.3 GW | 12.5 GW | 7.6 GW | 6.3 GW |
| Nov-25 | 12.3 GW | 12.8 GW | 7.5 GW | 6.3 GW |
| Dec-25 | 12.4 GW | 12.8 GW | 7.5 GW | 6.3 GW |
| Jan-26 | 12.7 GW | 12.5 GW | 7.5 GW | 6.3 GW |
| Feb-26 | 13.0 GW | 12.4 GW | 7.6 GW | 6.3 GW |
| Mar-26 | 13.1 GW | 12.5 GW | 7.6 GW | 6.4 GW |
| Apr-26 | 13.3 GW | 12.5 GW | 7.6 GW | 6.4 GW |
| May-26 | 13.4 GW | 12.5 GW | 7.6 GW | 6.7 GW |
| Jun-26 | 13.7 GW | 12.5 GW | 7.6 GW | 6.9 GW |
| Technology | December 2025 | June 2026 |
|---|---|---|
| Solar | 31.7% | 33.5% |
| Thermal | 32.6% | 30.7% |
| Hydro | 19.3% | 18.5% |
| Wind | 16.2% | 17% |
| Geothermal | 0.2% | 0.2% |
Source: National Electricity Coordinator, Half-yearly Competition Monitoring Report, chart 1.A.1, share of installed capacity.
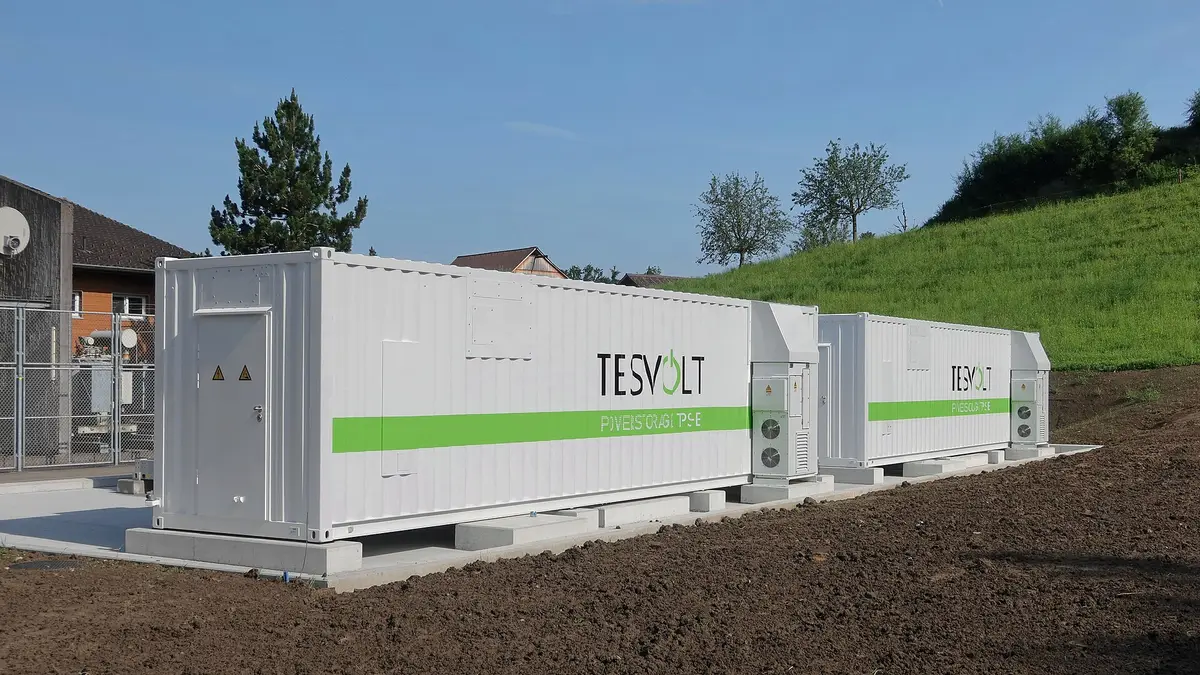
Batteries are the fastest change. Their capacity almost doubled in six months, from 2.6 GW to 5 GW, and the energy they discharge each day approached 10 GWh at the end of June. They charge during sunny hours and return the energy mainly after sunset. In frequency-control services, batteries reached shares of between 48% and 64% in the downward reserve service. We analysed the effect on prices in our story on marginal cost and batteries.
The payment chain and the companies with the most debt
In the short-term market, overdue debt averaged 1.59% of invoiced amounts between January and September, with a peak of 3% in April. In September it closed at CLP 2,830 million, 38.6% less than in August. The 20 largest debtors without guarantees owed CLP 945 million, 33.4% of the total, and the UMC recommends strengthening the guarantee regime.
Frequently asked questions
Why are transmission works declared void?
Because bids exceed the maximum value set. According to the UMC, reference values do not reflect current costs; awarded bids were, at the median, more than twice that value.
How many transmission works are delayed?
65% of the 144 works tracked by the Coordinator were delayed as of September 2026.
How much battery capacity does Chile's grid have?
About 5 GW as of June 2026, almost double the 2.6 GW of January, according to the report.
What is the Competition Monitoring Unit?
It is the area of the National Electricity Coordinator that monitors competition conditions in the electricity market. It publishes half-yearly and annual reports and can propose regulatory changes to the CNE.