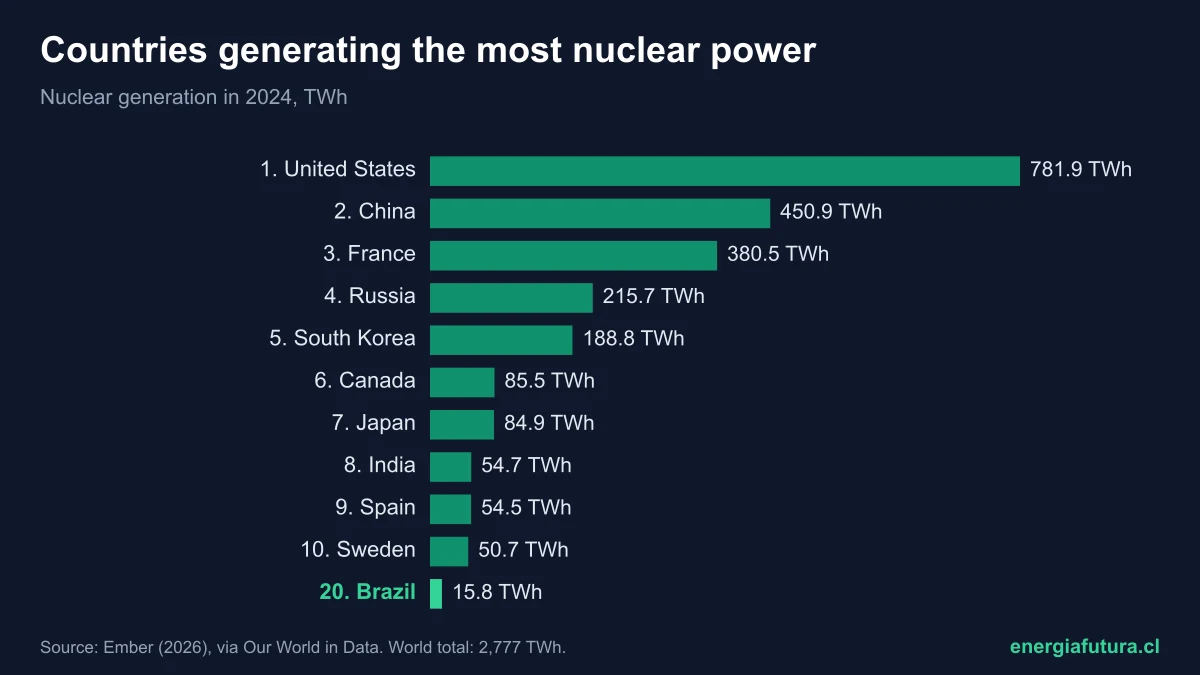
Updated on 11 November 2026. The United States is the country that generates the most nuclear power: 782 TWh in 2024, 28.2% of the world total, according to Ember data processed by Our World in Data. China is second, with 451 TWh, and France third, with 380 TWh: together the three account for 58.1%. In Latin America, Brazil, Mexico and Argentina generate nuclear power. Chile has no nuclear power plants.
The world generated 2,777 TWh of nuclear electricity in 2024 and, according to preliminary data, a record 2,812 TWh in 2025. But its weight in world electricity keeps falling: from 16.6% in 2000 to 8.8% in 2025, because renewables and coal grew more. This data sheet brings together the country ranking, the map, the countries where nuclear matters most and trends since 2000.
Ranking of the countries that generate the most nuclear power
Only 31 countries generated nuclear electricity in 2024 with Ember data. The table ranks them by generation; the fourth column shows what share of each country's electricity is nuclear and the last one, the preliminary 2025 figure.
| Rank | Country | TWh 2024 | % of its electricity | TWh 2025 (preliminary) |
|---|---|---|---|---|
| 1 | United States | 781.9 | 17.8% | 784.8 |
| 2 | China | 450.9 | 4.5% | 487.6 |
| 3 | France | 380.5 | 67.7% | 392.1 |
| 4 | Russia | 215.7 | 17.8% | 218.7 |
| 5 | South Korea | 188.8 | 30.2% | 184.7 |
| 6 | Canada | 85.5 | 13.4% | 85.3 |
| 7 | Japan | 84.9 | 8.4% | 94.1 |
| 8 | India | 54.7 | 2.7% | 53.8 |
| 9 | Spain | 54.5 | 19.4% | 54.1 |
| 10 | Sweden | 50.7 | 29.4% | 47.1 |
| 11 | United Arab Emirates | 40.6 | 22.9% | No data |
| 12 | United Kingdom | 40.6 | 14.3% | 36.4 |
| 13 | Finland | 32.6 | 39.5% | 32.8 |
| 14 | Belgium | 31.3 | 41.1% | 24.1 |
| 15 | Czechia | 29.7 | 40.8% | 31.9 |
| 20 | Brazil | 15.8 | 2.1% | 15.9 |
| 23 | Mexico | 12.3 | 3.5% | 10.2 |
| 26 | Argentina | 10.5 | 6.9% | 10.8 |
Source: Ember (2026), via Our World in Data. Shares of the world total calculated by Energía Futura. Ukraine, which before the war generated more than half of its electricity from nuclear power (55.1% in 2021), has no data since 2022 in this database, so it does not appear in the ranking.
The United States leads by size: it has the world's largest reactor fleet, although most of it was built between the 1970s and 1990s. China is the growth story: in 2000 it generated 17 TWh, in 2020 it overtook France and in 2025 it reached 488 TWh, up 8.2% in a year. Its new plants are among the largest in the world, as we detail in our ranking of the largest nuclear power plants.
View the data as a table
| France | 67.7% · 380.4 TWh |
| Slovakia | 61.8% · 18.2 TWh |
| Hungary | 42.2% · 16.0 TWh |
| Bulgaria | 41.2% · 15.8 TWh |
| Belgium | 41.1% · 31.3 TWh |
| Czech Republic | 40.8% · 29.7 TWh |
| Finland | 39.5% · 32.6 TWh |
| Slovenia | 34.9% · 5.8 TWh |
| Belarus | 34.2% · 15.7 TWh |
| Switzerland | 30.6% · 24.0 TWh |
| South Korea | 30.2% · 188.8 TWh |
| Sweden | 29.4% · 50.7 TWh |
| Armenia | 29.1% · 2.6 TWh |
| United Arab Emirates | 22.9% · 40.6 TWh |
| Romania | 20.7% · 10.9 TWh |
| Spain | 19.4% · 54.5 TWh |
| United States | 17.8% · 781.9 TWh |
| Russia | 17.8% · 215.7 TWh |
| United Kingdom | 14.3% · 40.6 TWh |
| Canada | 13.4% · 85.5 TWh |
| Pakistan | 13.1% · 22.9 TWh |
| Japan | 8.4% · 84.9 TWh |
| Argentina | 6.9% · 10.4 TWh |
| People's Republic of China | 4.5% · 450.9 TWh |
| Taiwan | 4.2% · 12.2 TWh |
| Mexico | 3.5% · 12.3 TWh |
| South Africa | 3.2% · 7.8 TWh |
| Netherlands | 2.9% · 3.6 TWh |
| India | 2.7% · 54.7 TWh |
| Brazil | 2.1% · 15.8 TWh |
| Iran | 1.9% · 7.3 TWh |
Where nuclear power matters most
Measured as a share of electricity, France leads: 67.7% of its 2024 generation was nuclear. It is followed by Slovakia (61.8%), Hungary (42.2%), Bulgaria (41.2%), Belgium (41.1%), Czechia (40.8%) and Finland (39.5%). Central and eastern Europe rely heavily on Soviet or Russian-designed reactors, which has put nuclear fuel at the centre of the energy security debate since 2022.
Other countries went the other way. Germany closed its last three reactors in April 2023 and its nuclear generation has been zero since then; in 2000 it was 29.8% of its electricity. Taiwan shut its last reactor in 2025, and its generation fell from 12.2 TWh in 2024 to 3.3 TWh. Japan is coming back: after the Fukushima accident in 2011, its nuclear generation fell to zero in 2014, and in 2025 it reached 94 TWh with the reactors it has restarted.
Nuclear power in Latin America
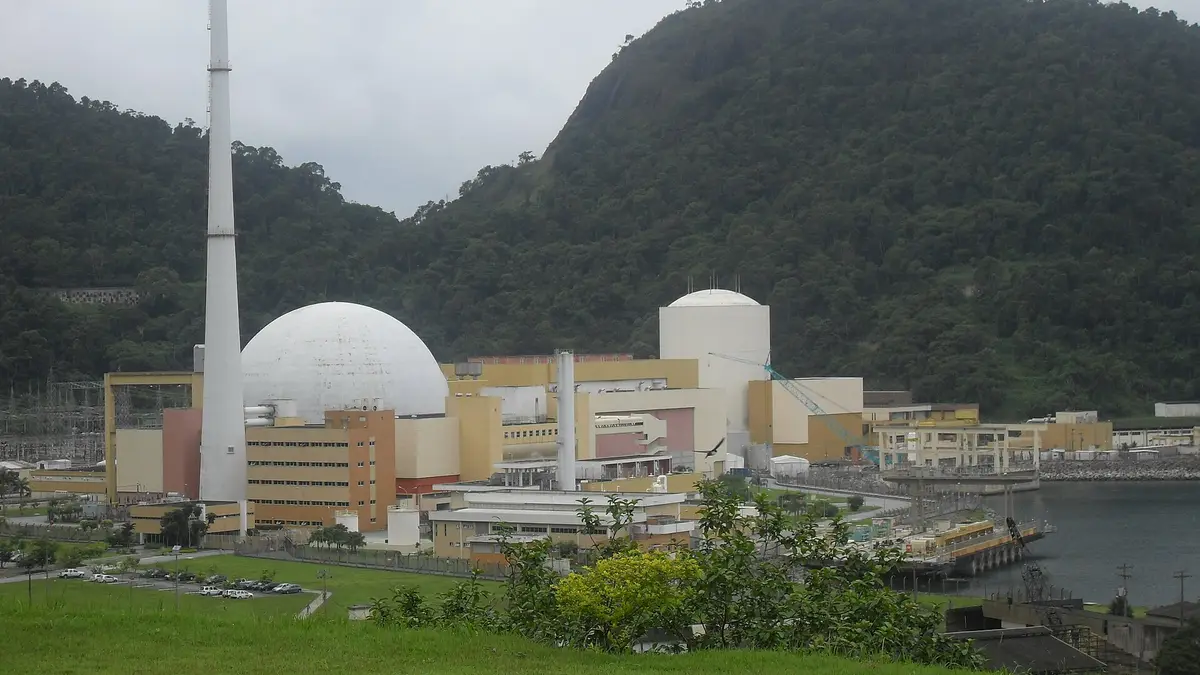
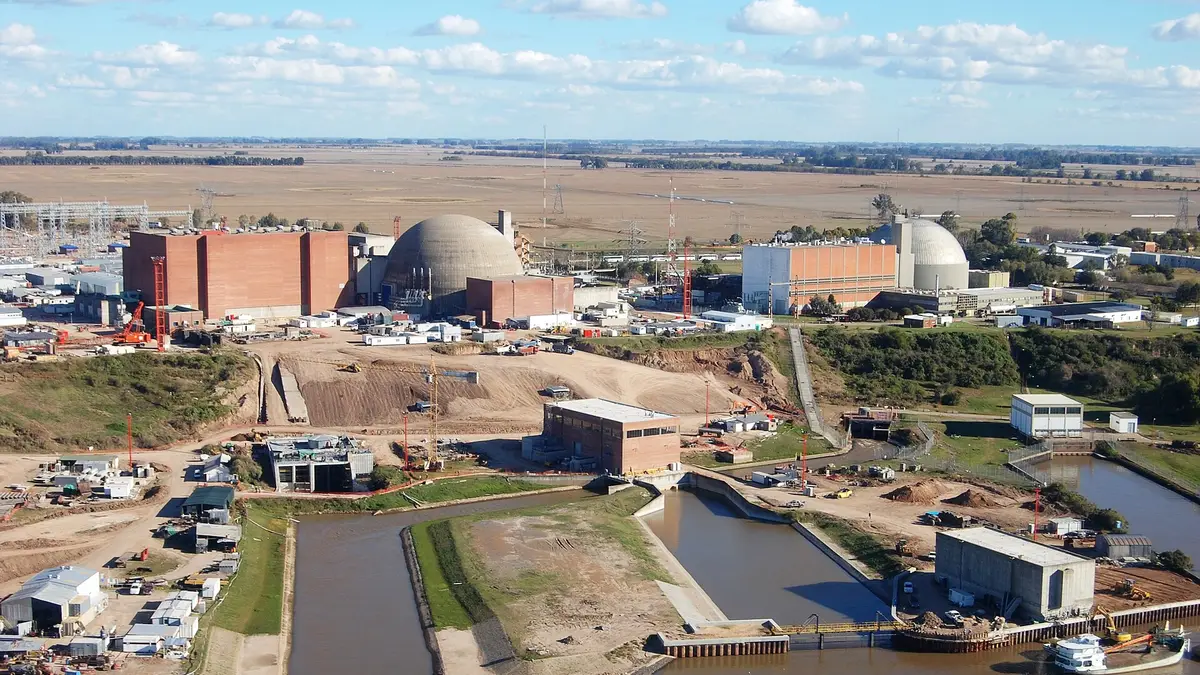
Three Latin American countries generate nuclear electricity. Brazil produced 15.8 TWh in 2024 with the Angra 1 and 2 plants, 2.1% of its electricity. Mexico generated 12.3 TWh with Laguna Verde, in Veracruz, 3.5%. Argentina, with Atucha I, Atucha II and Embalse, generated 10.5 TWh, 6.9%, the highest share in the region.
| Country | Plants | TWh 2024 | % of its electricity | TWh 2025 (preliminary) |
|---|---|---|---|---|
| Brazil | Angra 1 and 2 (Angra 3 under construction) | 15.8 | 2.1% | 15.9 |
| Mexico | Laguna Verde | 12.3 | 3.5% | 10.2 |
| Argentina | Atucha I, Atucha II and Embalse | 10.5 | 6.9% | 10.8 |
| Chile | None | 0 | 0% | 0 |
Source: Ember (2026), via Our World in Data. The list of plants is public information from each country's operators. Chile has research reactors run by the Chilean Nuclear Energy Commission, which do not supply electricity to the grid.
How nuclear power has changed since 2000
World nuclear generation rose from 2,540 TWh in 2000 to a first peak of 2,762 TWh in 2006, fell after Fukushima to 2,432 TWh in 2012 and slowly recovered to the record 2,812 TWh in 2025. Over the same period, total world electricity almost doubled, so the nuclear share fell from 16.6% to 8.8%.
View the data as a table
| World generation (TWh) | |
|---|---|
| 2000 | 2,540 |
| 2001 | 2,613 |
| 2002 | 2,655 |
| 2003 | 2,601 |
| 2004 | 2,719 |
| 2005 | 2,727 |
| 2006 | 2,762 |
| 2007 | 2,703 |
| 2008 | 2,695 |
| 2009 | 2,657 |
| 2010 | 2,726 |
| 2011 | 2,610 |
| 2012 | 2,432 |
| 2013 | 2,449 |
| 2014 | 2,499 |
| 2015 | 2,533 |
| 2016 | 2,571 |
| 2017 | 2,594 |
| 2018 | 2,659 |
| 2019 | 2,754 |
| 2020 | 2,648 |
| 2021 | 2,762 |
| 2022 | 2,640 |
| 2023 | 2,698 |
| 2024 | 2,777 |
| 2025 | 2,812 |
View the data as a table
| United States | China | France | Russia | South Korea | Japan | |
|---|---|---|---|---|---|---|
| 2000 | 754 TWh | 17 TWh | 415 TWh | 131 TWh | 109 TWh | 319 TWh |
| 2001 | 769 TWh | 17 TWh | 421 TWh | 137 TWh | 112 TWh | 321 TWh |
| 2002 | 780 TWh | 25 TWh | 437 TWh | 142 TWh | 119 TWh | 314 TWh |
| 2003 | 764 TWh | 43 TWh | 441 TWh | 150 TWh | 130 TWh | 230 TWh |
| 2004 | 789 TWh | 50 TWh | 448 TWh | 145 TWh | 131 TWh | 286 TWh |
| 2005 | 782 TWh | 53 TWh | 452 TWh | 149 TWh | 147 TWh | 293 TWh |
| 2006 | 787 TWh | 55 TWh | 450 TWh | 156 TWh | 149 TWh | 304 TWh |
| 2007 | 806 TWh | 62 TWh | 440 TWh | 160 TWh | 143 TWh | 279 TWh |
| 2008 | 806 TWh | 68 TWh | 439 TWh | 163 TWh | 151 TWh | 252 TWh |
| 2009 | 799 TWh | 70 TWh | 410 TWh | 164 TWh | 148 TWh | 275 TWh |
| 2010 | 807 TWh | 75 TWh | 429 TWh | 170 TWh | 149 TWh | 292 TWh |
| 2011 | 790 TWh | 87 TWh | 442 TWh | 173 TWh | 155 TWh | 163 TWh |
| 2012 | 769 TWh | 98 TWh | 425 TWh | 178 TWh | 150 TWh | 18 TWh |
| 2013 | 789 TWh | 112 TWh | 424 TWh | 173 TWh | 139 TWh | 15 TWh |
| 2014 | 797 TWh | 133 TWh | 436 TWh | 181 TWh | 156 TWh | 0 TWh |
| 2015 | 797 TWh | 171 TWh | 437 TWh | 195 TWh | 165 TWh | 5 TWh |
| 2016 | 806 TWh | 213 TWh | 403 TWh | 197 TWh | 162 TWh | 18 TWh |
| 2017 | 805 TWh | 248 TWh | 398 TWh | 203 TWh | 148 TWh | 29 TWh |
| 2018 | 807 TWh | 295 TWh | 413 TWh | 205 TWh | 134 TWh | 49 TWh |
| 2019 | 809 TWh | 349 TWh | 399 TWh | 209 TWh | 146 TWh | 66 TWh |
| 2020 | 790 TWh | 366 TWh | 354 TWh | 216 TWh | 160 TWh | 43 TWh |
| 2021 | 780 TWh | 408 TWh | 379 TWh | 222 TWh | 158 TWh | 61 TWh |
| 2022 | 772 TWh | 418 TWh | 295 TWh | 224 TWh | 176 TWh | 52 TWh |
| 2023 | 775 TWh | 435 TWh | 338 TWh | 217 TWh | 180 TWh | 77 TWh |
| 2024 | 782 TWh | 451 TWh | 380 TWh | 216 TWh | 189 TWh | 85 TWh |
| 2025 | 785 TWh | 488 TWh | 392 TWh | 219 TWh | 185 TWh | 94 TWh |
View the data as a table
| 2000 | 2001 | 2002 | 2003 | 2004 | 2005 | 2006 | 2007 | 2008 | 2009 | 2010 | 2011 | 2012 | 2013 | 2014 | 2015 | 2016 | 2017 | 2018 | 2019 | 2020 | 2021 | 2022 | 2023 | 2024 | |
|---|---|---|---|---|---|---|---|---|---|---|---|---|---|---|---|---|---|---|---|---|---|---|---|---|---|
| United States | 754 | 769 | 780 | 764 | 789 | 782 | 787 | 806 | 806 | 799 | 807 | 790 | 769 | 789 | 797 | 797 | 806 | 805 | 807 | 809 | 790 | 780 | 772 | 775 | 782 |
| France | 415 | 421 | 437 | 441 | 448 | 452 | 450 | 440 | 439 | 410 | 429 | 442 | 425 | 424 | 436 | 437 | 403 | 398 | 413 | 399 | 354 | 379 | 295 | 338 | 380 |
| Japan | 319 | 321 | 314 | 230 | 286 | 293 | 304 | 279 | 252 | 275 | 292 | 163 | 18 | 15 | 0 | 5 | 18 | 29 | 49 | 66 | 43 | 61 | 52 | 77 | 85 |
| Germany | 170 | 171 | 165 | 165 | 167 | 163 | 167 | 141 | 148 | 135 | 141 | 108 | 99 | 97 | 97 | 92 | 85 | 76 | 76 | 75 | 64 | 69 | 35 | 7 | 0 |
| Russia | 131 | 137 | 142 | 150 | 145 | 149 | 156 | 160 | 163 | 164 | 170 | 173 | 178 | 173 | 181 | 195 | 197 | 203 | 205 | 209 | 216 | 222 | 224 | 217 | 216 |
| South Korea | 109 | 112 | 119 | 130 | 131 | 147 | 149 | 143 | 151 | 148 | 149 | 155 | 150 | 139 | 156 | 165 | 162 | 148 | 134 | 146 | 160 | 158 | 176 | 180 | 189 |
| United Kingdom | 85 | 90 | 88 | 89 | 80 | 82 | 75 | 63 | 52 | 69 | 62 | 69 | 70 | 71 | 64 | 70 | 72 | 70 | 65 | 56 | 50 | 46 | 47 | 41 | 41 |
| Canada | 72 | 76 | 75 | 74 | 90 | 91 | 97 | 93 | 95 | 89 | 90 | 93 | 94 | 103 | 107 | 101 | 101 | 101 | 100 | 100 | 98 | 92 | 87 | 88 | 85 |
| Spain | 62 | 64 | 63 | 62 | 64 | 58 | 60 | 55 | 59 | 53 | 62 | 58 | 61 | 57 | 57 | 57 | 59 | 58 | 56 | 58 | 58 | 57 | 59 | 57 | 55 |
| Sweden | 57 | 72 | 68 | 67 | 77 | 72 | 67 | 67 | 64 | 52 | 58 | 60 | 64 | 66 | 65 | 56 | 63 | 66 | 69 | 66 | 49 | 53 | 52 | 48 | 51 |
| China | 17 | 17 | 25 | 43 | 50 | 53 | 55 | 62 | 68 | 70 | 75 | 87 | 98 | 112 | 133 | 171 | 213 | 248 | 295 | 349 | 366 | 408 | 418 | 435 | 451 |
| India | 16 | 19 | 19 | 18 | 21 | 18 | 18 | 18 | 15 | 17 | 23 | 32 | 33 | 33 | 35 | 38 | 38 | 37 | 39 | 45 | 45 | 44 | 46 | 48 | 55 |
The uranium that fuels these reactors comes from a few countries: Kazakhstan produced 38.6% of mined uranium in 2024 and, with Canada and Namibia, leads world production, as shown in our ranking of uranium producers. That concentration, more than price, is what worries countries that depend on nuclear power.
What's next for nuclear power
Nuclear power is back on the agenda for two reasons: it is a low-emission source that works day and night, and electricity demand is growing with data centres. Several tech companies have signed contracts with existing plants and small modular reactor (SMR) projects, and COP28 included a call by more than 20 countries to triple nuclear capacity by 2050. The challenge remains the cost and construction time of new plants.
In Chile, the debate is narrower: the country covers its growth with solar, wind and batteries, and reached more than 80% renewable electricity in some months of 2026. How it compares with other countries is in our renewable electricity ranking.
For Chile, nuclear power is not part of official electricity planning, which projects covering demand growth with renewables and storage. But the country takes part in the nuclear market in another way: it is a major producer of metals the industry uses, and Chilean lithium could play a role in future fusion reactors, a use that is still only experimental.
The comparison between countries also shows the weight of size. France, with 68 million people, generates almost half as much nuclear power as the United States, which has five times its population. That is why the countries most dependent on nuclear power in proportion tend to be medium or small European countries, not the largest generators.
| Year | World nuclear generation (TWh) | % of world electricity | Milestone |
|---|---|---|---|
| 2000 | 2,540 | 16.6% | — |
| 2006 | 2,762 | 14.7% | First peak |
| 2011 | 2,610 | 11.9% | Fukushima accident |
| 2012 | 2,432 | 10.8% | Low after Fukushima |
| 2020 | 2,648 | 9.9% | China passes France |
| 2024 | 2,777 | 9.0% | — |
| 2025 (preliminary) | 2,812 | 8.8% | All-time record |
Source: Ember (2026), via Our World in Data.
| 1 | United States | 781.9 | 17.8 | 784.8 |
| 2 | China | 450.9 | 4.5 | 487.6 |
| 3 | France | 380.4 | 67.7 | 392.1 |
| 4 | Russia | 215.7 | 17.8 | 218.7 |
| 5 | South Korea | 188.8 | 30.2 | 184.7 |
| 6 | Canada | 85.5 | 13.4 | 85.3 |
| 7 | Japan | 84.9 | 8.4 | 94.1 |
| 8 | India | 54.7 | 2.7 | 53.8 |
| 9 | Spain | 54.5 | 19.4 | 54.1 |
| 10 | Sweden | 50.7 | 29.4 | 47.1 |
| 11 | United Arab Emirates | 40.6 | 22.9 | No data |
| 12 | United Kingdom | 40.6 | 14.3 | 36.4 |
| 13 | Finland | 32.6 | 39.5 | 32.8 |
| 14 | Belgium | 31.3 | 41.1 | 24.1 |
| 15 | Czechia | 29.7 | 40.8 | 31.9 |
| 16 | Switzerland | 24.0 | 30.6 | 19.4 |
| 17 | Pakistan | 22.9 | 13.1 | 23.7 |
| 18 | Slovakia | 18.2 | 61.8 | 19.3 |
| 19 | Hungary | 16.0 | 42.2 | 16.1 |
| 20 | Brazil | 15.8 | 2.1 | 15.9 |
| 21 | Bulgaria | 15.8 | 41.2 | 14.8 |
| 22 | Belarus | 15.7 | 34.2 | 17.0 |
| 23 | Mexico | 12.3 | 3.5 | 10.2 |
| 24 | Taiwan | 12.2 | 4.2 | 3.3 |
| 25 | Romania | 10.9 | 20.7 | 10.2 |
| 26 | Argentina | 10.4 | 6.9 | 10.8 |
| 27 | South Africa | 7.8 | 3.2 | 10.2 |
| 28 | Iran | 7.3 | 1.9 | 7.3 |
| 29 | Slovenia | 5.8 | 34.9 | 5.8 |
| 30 | Netherlands | 3.6 | 2.9 | 4.0 |
| 31 | Armenia | 2.6 | 29.1 | 2.6 |
Methodology
The data come from Ember, processed by Our World in Data. Nuclear generation is the gross electricity produced by nuclear plants in each country. The ranking uses 2024 because it is the last complete year; 2025 data are preliminary and some countries are missing, such as the United Arab Emirates. Ukraine has no data since 2022 in this database.
How to cite this data
Energía Futura (2026). "Countries that generate the most nuclear power 2026: world ranking and Latin America". Updated on 11 November 2026. energiafutura.cl/en/news/countries-that-generate-the-most-nuclear-power-2026-world-ranking-and-latin-america. Data: Ember (2026), Yearly Electricity Data, processed by Our World in Data.
Does your company work in power generation, transmission or storage? Reach Energía Futura's readers.
See advertising formatsFrequently asked questions
Which country generates the most nuclear power?
The United States, with 782 TWh in 2024, 28.2% of the world total.
Which country depends most on nuclear power?
France: 67.7% of its electricity was nuclear in 2024. Slovakia follows with 61.8%.
How much nuclear power is generated worldwide?
2,777 TWh in 2024 and a record 2,812 TWh in 2025, according to preliminary data: 8.8% of world electricity.
Which Latin American countries have nuclear power?
Brazil (15.8 TWh), Mexico (12.3 TWh) and Argentina (10.5 TWh). Argentina depends on it most, with 6.9% of its electricity.
Does Chile have nuclear power plants?
No. It has research reactors run by the Chilean Nuclear Energy Commission, which do not supply electricity to the grid.
Why is Ukraine not in the ranking?
Because Ember's database has no generation data for Ukraine since 2022, due to the war. In 2021, the country generated 86.2 TWh of nuclear power, 55.1% of its electricity, which would have placed it in the top ten.
Is nuclear power growing?
In volume, yes: 2025 set a record of 2,812 TWh, driven by China and Japan. As a share of world electricity, it keeps falling.