Chile's copper production reached 385,100 tonnes of fine copper in September 2026, 15% less than the 453,300 tonnes of September 2025, according to company-by-company figures from the Chilean Copper Commission (Cochilco) released on 10 November and reported by Redimin and Electrominería. It is the lowest September in at least two decades.
Between January and September, Chilean mines produced 3,633,100 tonnes, 8.5% less than in the same period of 2025. That is 338,500 tonnes less copper in nine months, and the lowest total for that period since at least 2006, according to Redimin's analysis of the Cochilco series.
View the data as a table
| September output | 385,100 t |
| January to September | 3,633,100 t |
| Copper lost in 2026 | 338,500 t |
| 2026 projection | 4.94 million t |
Chile's copper production, operation by operation
The decline is concentrated in a few operations. Escondida, owned by BHP and the world's largest copper mine, produced 891,300 tonnes from January to September, 12.5% less than a year earlier. Codelco produced 932,700 tonnes (−8.2%) and Spence, also BHP's, fell 25.7% to 146,500 tonnes. According to Cochilco, those three operations explain 77.3% of the national decline.
| Operation or company | September 2026 (t) | September 2025 (t) | January-September 2026 (t) | Jan-Sep change |
|---|---|---|---|---|
| Chile total | 385,100 | 453,300 | 3,633,100 | −8.5% |
| Codelco | 99,300 | 115,600 | 932,700 | −8.2% |
| Escondida (BHP) | 93,800 | 118,600 | 891,300 | −12.5% |
| Collahuasi | 30,700 | 38,000 | 280,600 | −5.6% |
| Los Pelambres | 26,800 | 25,000 | 221,900 | −1.6% |
| Anglo American Sur | 16,100 | 17,900 | 166,000 | +7.1% |
| Quebrada Blanca | 11,600 | 5,800 | 158,500 | +17.8% |
| Spence (BHP) | 15,300 | 21,100 | 146,500 | −25.7% |
| Centinela (sulphides) | 11,100 | 16,300 | 102,000 | −18.7% |
| Centinela (oxides) | 8,900 | 13,400 | 41,900 | −19.2% |
Source: Cochilco, production by company through September 2026, via Redimin and Electrominería (10 November 2026). Codelco's figure includes its stakes in other operations; at its own divisions it produced 853,000 tonnes (−9%).
September was especially weak at Escondida: it produced 93,800 tonnes, 20.9% less than in September 2025. Codelco's monthly drop was 14.1%. The only large operations growing this year are Teck's Quebrada Blanca, which doubled its September output (from 5,800 to 11,600 tonnes) and is up 17.8% year to date, and Anglo American Sur, up 7.1%.
View the data as a table
| Escondida | 891,300 |
| Collahuasi | 280,600 |
| Los Pelambres | 221,900 |
| Anglo American Sur (Los Bronces) | 166,000 |
| Quebrada Blanca | 158,500 |
| Spence | 146,500 |
| Centinela | 143,900 |
| Candelaria | 86,500 |
Why copper production is falling
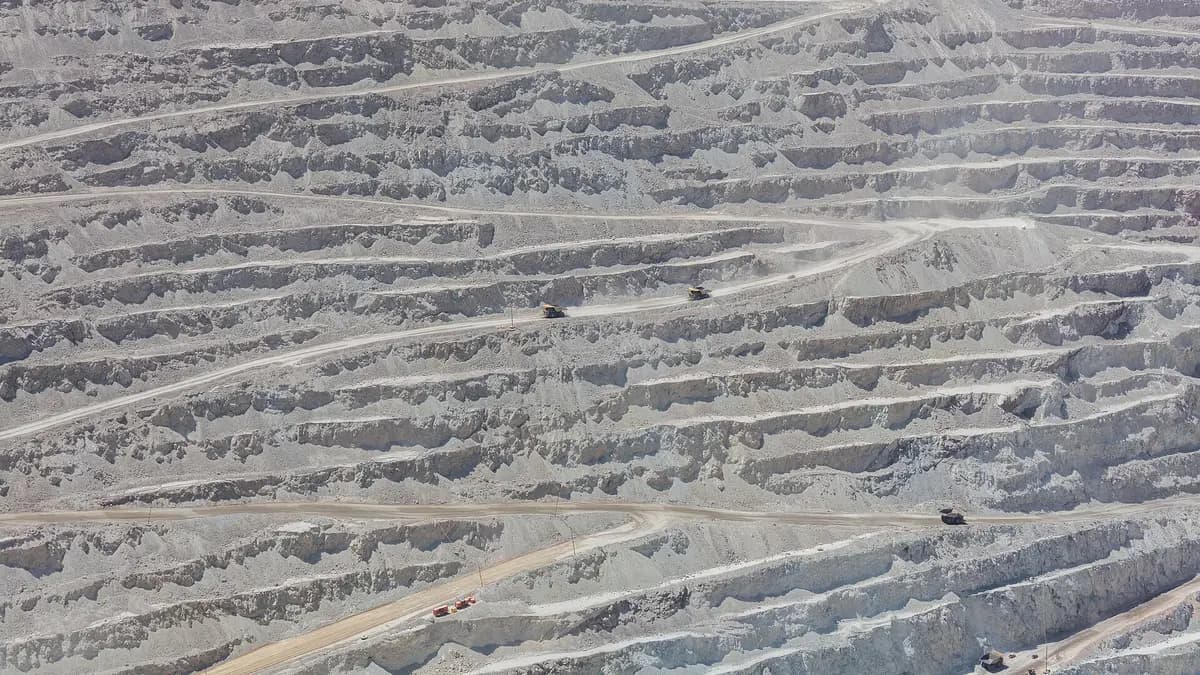
Cochilco attributes the drop to three factors: lower ore grades (each tonne of rock carries less copper), maintenance at processing plants and operational disruptions at several sites. A harsh winter added to it: in August, the worst month of the year, several companies reported stoppages due to storms and heavy snow, as we explained in our story on January-August output.
The underlying problem is ageing deposits. To produce the same amount of copper, mines must move and process more rock, which also takes more energy and water per tonne. Climate adds pressure: a study by the University of Chile's AMTC estimated that droughts could affect up to 10.7% of output by 2030, as we explained in our story on that study.
That greater effort per tonne has a direct effect on mining's footprint. When grades fall, the electricity used for crushing, grinding and pumping water rises, and so do emissions if that energy is not renewable. That is why productivity and decarbonisation of mining operations are now part of the same problem.
The industry has responded with renewable power contracts and process electrification: many of the large mines already buy electricity certified as renewable. But that progress does not offset geological decline, and a recovery depends on new expansions coming online, such as those being prepared by Codelco, BHP and Teck.
Copper production below 5 million tonnes
At this pace, 2026 output would be around 4.94 million tonnes, a contraction of 8.4%, according to the projection cited by Redimin. To reach that figure, the country would need to produce about 434,000 tonnes a month in the fourth quarter, 7.6% more than the January-September average. It would be the first time since at least 2005 that Chile falls below 5 million tonnes.
| Indicator | Figure | Comment |
|---|---|---|
| January-September 2026 output | 3,633,100 t | −8.5% year on year |
| January-September 2025 output | 3,971,600 t | Calculated with the 338,500 t drop |
| 2026 monthly average | 403,700 t | Calculated by Energía Futura |
| Pace needed in the fourth quarter | ~434,000 t a month | +7.6% over the average |
| 2026 projection | ~4.94 million t | −8.4%; below 5 million for the first time since 2005 |
| 2027 projection | ~5.08 million t | +3% |
Source: Cochilco, via Redimin (10 November 2026). The monthly average and the 2025 total are Energía Futura calculations based on the reported figures. The most recent projection in Cochilco's August market report was higher, at 5.27 million tonnes; the weak July, August and September data leave it behind.
The 2027 recovery would be partial: a 3% rise to about 5.08 million tonnes would recover only a third of this year's loss. The 2018 record remains far away, and Chile keeps its first place in the world partly because other producers are not growing as expected either, as shown in our ranking of the world's largest copper producers.
Fewer tonnes, but a high copper price
The decline comes with copper expensive. The year-to-date average price is close to US$6.15 per pound and the first week of November closed near US$6.33, according to Redimin. That is why copper exports are rising despite lower output: from January to October they reached US$54.655 billion, 15.8% more than in 2025, as we reported in our story on lithium and copper exports.
The price does not offset everything. Fewer tonnes mean less work for contractors, fewer purchases from regional suppliers and lower revenue from the mining royalty, which depends on both price and volume. And if output does not recover, Chile loses weight in a market that, according to the International Energy Agency, will need more copper for power grids, electric cars and data centres.
| Codelco | 932,700 | -8.2% |
| Escondida | 891,300 | -12.5% |
| Collahuasi | 280,600 | -5.6% |
| Los Pelambres | 221,900 | -1.6% |
| Anglo American Sur | 166,000 | 7.1% |
| Quebrada Blanca | 158,500 | 17.8% |
| Spence | 146,500 | -25.7% |
| Centinela (sulfuros) | 102,000 | -18.7% |
| Mantos Copper | 100,100 | -14.0% |
| Candelaria | 86,500 | -9.8% |
| El Abra | 62,600 | -11.5% |
| Zaldívar | 49,400 | -3.6% |
| Lomas Bayas | 44,000 | 0.0% |
| Centinela (óxidos) | 41,900 | -19.2% |
| Other producers | 428,800 | -4.9% |
Does your company work in mining, energy efficiency or mine electrification? Reach Energía Futura's readers.
See advertising formatsFrequently asked questions
How much copper did Chile produce in September 2026?
385,100 tonnes of fine copper, 15% less than in September 2025, according to Cochilco.
How much has copper production fallen in 2026?
From January to September it totalled 3,633,100 tonnes, 8.5% less than in 2025: 338,500 tonnes less.
Which mines explain the decline?
Escondida (−12.5%), Codelco (−8.2% including stakes; −9% at its own divisions) and Spence (−25.7%) account for 77.3% of the drop, according to Cochilco.
Is any mine producing more copper than in 2025?
Yes. Teck's Quebrada Blanca is up 17.8%, and Anglo American Sur is up 7.1%.
How much copper would Chile produce in 2026?
About 4.94 million tonnes, according to the projection cited by Redimin: the first time below 5 million since at least 2005.