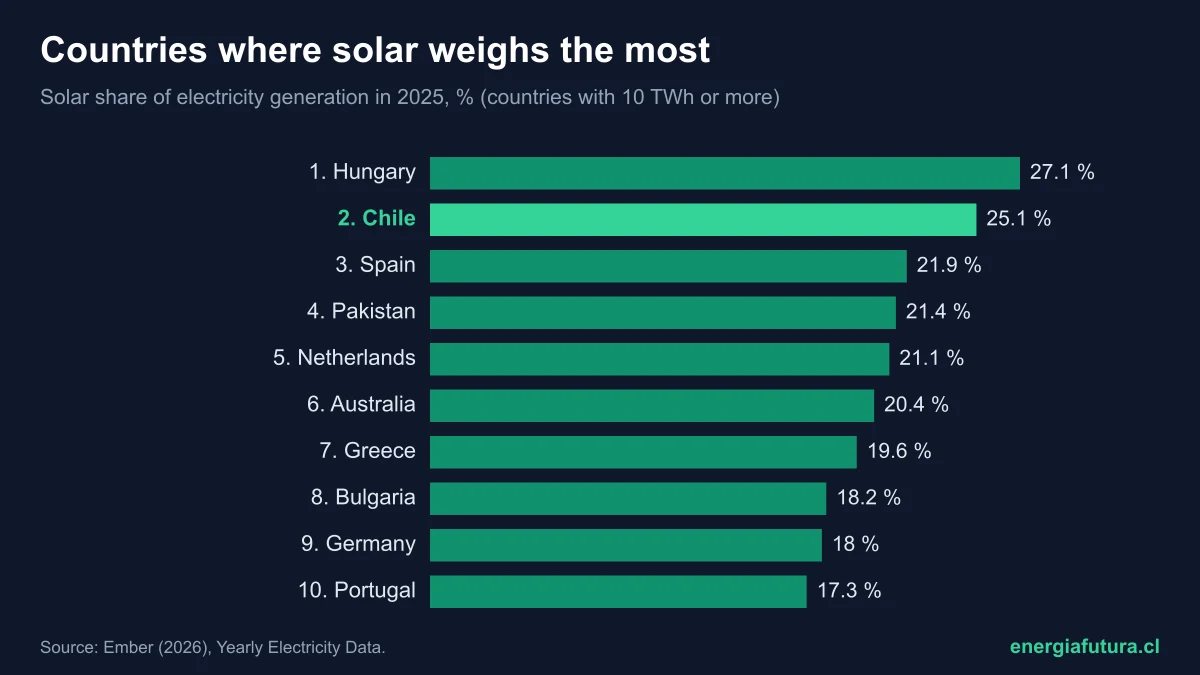
Updated on 16 November 2026. Chile is the second country in the world where solar power weighs most in electricity: it generated 25.1% of its electricity from the sun in 2025, 22.2 TWh out of a total of 88.5 TWh, according to annual data from Ember, the British think tank that compiles official statistics for each country. Only Hungary is ahead, with 27.1%. Spain (21.9%), Pakistan (21.4%) and the Netherlands (21.1%) complete the top five. The world average is 8.8%.
The ranking measures solar's share of each country's electricity generation, not the size of its solar fleet. That is why it is not led by China, which generates more solar power than anyone, but by countries where the sun already supplies a quarter of all electricity. This data sheet brings together the 2025 ranking of the 81 countries that generate at least 10 TWh a year and have 2025 data, how it has changed since 2010, the situation in Latin America and Chile's place.
View the data as a table
| Hungary, first | 27.1% |
| Chile, second | 25.1% |
| World average | 8.8% |
| Countries above 10% | 25 |
Ranking of countries with the highest share of solar power in electricity
The table ranks countries by the percentage of their electricity generated with solar panels and solar thermal plants in 2025. The last column shows their 2024 position on the same basis.
| # | Country | Solar share 2025 | Solar generation 2025 (TWh) | Capacity (GW) | 2024 rank |
|---|---|---|---|---|---|
| 1 | Hungary | 27.1% | 10.9 | 8.2 | 1 |
| 2 | Chile | 25.1% | 22.2 | 12.1 | 2 |
| 3 | Spain | 21.9% | 63.0 | 47.2 | 3 |
| 4 | Pakistan | 21.4% | 36.6 | 3.7 | 13 |
| 5 | Netherlands | 21.1% | 28.5 | 25.9 | 6 |
| 6 | Australia | 20.4% | 58.4 | 41.1 | 5 |
| 7 | Greece | 19.6% | 11.4 | 11.1 | 4 |
| 8 | Bulgaria | 18.2% | 6.9 | 5.9 | 11 |
| 9 | Germany | 18.0% | 89.7 | 106.3 | 9 |
| 10 | Portugal | 17.3% | 8.9 | 7.0 | 10 |
Source: Ember (2026), Yearly Electricity Data. Countries generating at least 10 TWh a year. Pakistan's capacity excludes the large volume of rooftop panels that Ember estimates separately.
Pakistan is the most striking case of the year: it climbed from 13th to 4th and its solar share rose from 13.1% to 21.4% in a single year. Much of that jump comes from the mass import of cheap Chinese panels that households and businesses installed on their roofs to escape high tariffs and power cuts. At the other end, Greece was the only top-10 country whose share did not rise: it went from 19.7% to 19.6%.
View the data as a table
| Hungary | 27.1% |
| Chile | 25.1% |
| Spain | 21.9% |
| Pakistan | 21.4% |
| Netherlands | 21.1% |
| Australia | 20.4% |
| Greece | 19.6% |
| Bulgaria | 18.2% |
| Germany | 18.0% |
| Portugal | 17.3% |
| Italy | 16.8% |
| Israel | 16.2% |
| Belgium | 14.5% |
| Austria | 14.1% |
| Sri Lanka | 13.2% |
| Denmark | 12.8% |
| Switzerland | 12.1% |
| Brazil | 11.5% |
| Poland | 11.3% |
| People's Republic of China | 11.2% |
| Japan | 10.8% |
| Cambodia | 10.6% |
| Türkiye | 10.5% |
| Vietnam | 10.3% |
| Slovenia | 10.1% |
| Dominican Republic | 10.0% |
| Romania | 10.0% |
| United Arab Emirates | 9.9% |
| India | 9.4% |
| Croatia | 8.9% |
| United States | 8.6% |
| South Africa | 8.0% |
| Uzbekistan | 7.5% |
| Mexico | 7.0% |
| United Kingdom | 6.6% |
| South Korea | 6.0% |
| Morocco | 5.8% |
| Czech Republic | 5.8% |
| France | 5.6% |
| Taiwan | 5.5% |
| Uruguay | 5.2% |
| Colombia | 5.1% |
| Oman | 5.0% |
| Thailand | 5.0% |
| Kenya | 4.8% |
| Puerto Rico | 4.7% |
| Ireland | 4.6% |
| Bosnia and Herzegovina | 4.0% |
| Saudi Arabia | 3.9% |
| Egypt | 3.9% |
| Argentina | 3.4% |
| Malaysia | 3.2% |
| Peru | 3.1% |
| Bolivia | 3.0% |
| Singapore | 2.7% |
| Sweden | 2.6% |
| Tunisia | 2.5% |
| Slovakia | 2.5% |
| Philippines | 2.4% |
| Kazakhstan | 1.7% |
| Bangladesh | 1.5% |
| Canada | 1.4% |
| Finland | 1.2% |
| New Zealand | 1.1% |
| Serbia | 1.0% |
| Costa Rica | 0.8% |
| Iran | 0.6% |
| Belarus | 0.3% |
| Nigeria | 0.3% |
| Norway | 0.3% |
| Indonesia | 0.3% |
| Kuwait | 0.3% |
| Russia | 0.2% |
| Ethiopia | 0.1% |
| Azerbaijan | 0.1% |
| Ecuador | 0.1% |
| Iceland | 0.1% |
| Georgia | 0.0% |
| Kyrgyzstan | 0.0% |
| Paraguay | 0.0% |
| Tajikistan | 0.0% |
In all, 25 countries already generate more than 10% of their electricity from the sun and 6 exceed 20%. Most are in Europe, but Australia, Israel, Pakistan, Vietnam, Cambodia and Chile also appear. The full sheet, with all 81 countries, can be sorted and searched in the following table.
| 1 | Hungary | 27.1% | 10.9 | 8.2 |
| 2 | Chile | 25.1% | 22.2 | 12.1 |
| 3 | Spain | 21.9% | 63.0 | 47.2 |
| 4 | Pakistan | 21.4% | 36.6 | 3.7 |
| 5 | Netherlands | 21.1% | 28.5 | 25.9 |
| 6 | Australia | 20.4% | 58.4 | 41.1 |
| 7 | Greece | 19.6% | 11.4 | 11.1 |
| 8 | Bulgaria | 18.2% | 6.9 | 5.9 |
| 9 | Germany | 18.0% | 89.7 | 106.3 |
| 10 | Portugal | 17.3% | 8.9 | 7.0 |
| 11 | Italy | 16.8% | 44.6 | 41.2 |
| 12 | Israel | 16.2% | 13.3 | 7.4 |
| 13 | Belgium | 14.5% | 10.4 | 10.4 |
| 14 | Austria | 14.1% | 10.3 | 10.3 |
| 15 | Sri Lanka | 13.2% | 2.5 | No data |
| 16 | Denmark | 12.8% | 4.6 | 5.1 |
| 17 | Switzerland | 12.1% | 7.9 | 9.1 |
| 18 | Brazil | 11.5% | 88.0 | 64.7 |
| 19 | Poland | 11.3% | 19.5 | 25.4 |
| 20 | People's Republic of China | 11.2% | 1,173.2 | 1,202.2 |
| 21 | Japan | 10.8% | 110.8 | 92.2 |
| 22 | Cambodia | 10.6% | 1.9 | 1.5 |
| 23 | Turkey | 10.5% | 37.3 | 25.5 |
| 24 | Vietnam | 10.3% | 33.8 | No data |
| 25 | Slovenia | 10.1% | 1.5 | 1.6 |
| 26 | Dominican Republic | 10.0% | 2.3 | 2.1 |
| 27 | Romania | 10.0% | 5.0 | 6.2 |
| 28 | United Arab Emirates | 9.9% | 18.2 | No data |
| 29 | India | 9.4% | 194.6 | 135.5 |
| 30 | Croatia | 8.9% | 1.3 | 1.3 |
| 31 | United States | 8.6% | 388.8 | 211.6 |
| 32 | South Africa | 8.0% | 19.5 | 11.3 |
| 33 | Uzbekistan | 7.5% | 6.5 | 5.9 |
| 34 | Mexico | 7.0% | 27.1 | 12.9 |
| 35 | United Kingdom | 6.6% | 19.4 | 21.7 |
| 36 | South Korea | 6.0% | 37.9 | 30.4 |
| 37 | Morocco | 5.8% | 2.6 | 1.1 |
| 38 | Czechia | 5.8% | 4.4 | 4.5 |
| 39 | France | 5.6% | 32.0 | 31.2 |
| 40 | Taiwan | 5.5% | 16.0 | 15.5 |
| 41 | Uruguay | 5.2% | 0.6 | 0.3 |
| 42 | Colombia | 5.1% | 4.6 | 1.7 |
| 43 | Oman | 5.0% | 2.7 | 1.7 |
| 44 | Thailand | 5.0% | 10.0 | 6.8 |
| 45 | Kenya | 4.8% | 0.7 | 0.6 |
| 46 | Puerto Rico | 4.7% | 0.9 | 1.4 |
| 47 | Ireland | 4.6% | 1.5 | 2.5 |
| 48 | Bosnia and Herzegovina | 4.0% | 0.6 | 0.7 |
| 49 | Saudi Arabia | 3.9% | 18.2 | No data |
| 50 | Egypt | 3.9% | 9.3 | 3.3 |
| 51 | Argentina | 3.4% | 5.2 | 2.6 |
| 52 | Malaysia | 3.2% | 6.6 | 3.1 |
| 53 | Peru | 3.1% | 1.9 | 1.0 |
| 54 | Bolivia | 3.0% | 0.4 | 0.2 |
| 55 | Singapore | 2.7% | 1.6 | 1.5 |
| 56 | Sweden | 2.6% | 4.4 | 5.5 |
| 57 | Tunisia | 2.5% | 0.6 | 0.9 |
| 58 | Slovakia | 2.5% | 0.7 | 1.0 |
| 59 | Philippines | 2.4% | 3.0 | 3.9 |
| 60 | Kazakhstan | 1.7% | 2.1 | 1.3 |
| 61 | Bangladesh | 1.5% | 1.6 | 1.2 |
| 62 | Canada | 1.4% | 9.0 | 5.9 |
| 63 | Finland | 1.2% | 1.0 | 1.6 |
| 64 | New Zealand | 1.1% | 0.5 | 0.8 |
| 65 | Serbia | 1.0% | 0.3 | 0.4 |
| 66 | Costa Rica | 0.8% | 0.1 | 0.1 |
| 67 | Iran | 0.6% | 2.2 | 1.8 |
| 68 | Belarus | 0.3% | 0.2 | 0.3 |
| 69 | Nigeria | 0.3% | 0.1 | 0.3 |
| 70 | Norway | 0.3% | 0.5 | 0.9 |
| 71 | Indonesia | 0.3% | 1.6 | No data |
| 72 | Kuwait | 0.3% | 0.2 | 0.1 |
| 73 | Russia | 0.2% | 2.9 | 2.4 |
| 74 | Ethiopia | 0.1% | 0.0 | 0.0 |
| 75 | Azerbaijan | 0.1% | 0.0 | 0.3 |
| 76 | Ecuador | 0.1% | 0.0 | 0.1 |
| 77 | Iceland | 0.1% | 0.0 | No data |
| 78 | Georgia | 0.0% | 0.0 | 0.3 |
| 79 | Kyrgyzstan | 0.0% | 0.0 | No data |
| 80 | Paraguay | 0.0% | 0.0 | 0.0 |
| 81 | Tajikistan | 0.0% | 0.0 | 0.0 |
How solar's share has changed since 2010
In 2015 solar generated just 1.1% of the world's electricity. In 2025 it reached 8.8%, with 2,807 TWh, adding 646 TWh in the last year alone, more than all the electricity Brazil consumes in eight months. No other type of power plant grew as much over the past decade.
The race between countries shows how leadership changed. In 2015 the leaders were Italy, Greece and Germany, the pioneers that subsidised panels when they were still expensive. From 2019, with much cheaper panels, Chile, Hungary, the Netherlands and Australia moved up: Chile topped the ranking in 2022 and 2023, and Hungary since 2024. Hungary has a small power system, 40 TWh, and a strong rooftop programme for households; Chile, by contrast, taps the radiation of the Atacama Desert with large grid-connected plants.
View the data as a table
| 2010 | 2011 | 2012 | 2013 | 2014 | 2015 | 2016 | 2017 | 2018 | 2019 | 2020 | 2021 | 2022 | 2023 | 2024 | 2025 | |
|---|---|---|---|---|---|---|---|---|---|---|---|---|---|---|---|---|
| Hungary | 0.0% | 0.0% | 0.0% | 0.1% | 0.2% | 0.5% | 0.8% | 1.1% | 2.0% | 4.4% | 7.0% | 10.5% | 13.2% | 19.5% | 24.2% | 27.1% |
| Chile | 0.0% | 0.0% | 0.0% | 0.0% | 0.7% | 1.7% | 3.3% | 4.9% | 6.3% | 7.5% | 9.0% | 12.0% | 17.3% | 20.1% | 22.8% | 25.1% |
| Spain | 2.4% | 3.2% | 4.1% | 4.7% | 5.0% | 5.0% | 5.0% | 5.3% | 4.7% | 5.6% | 8.0% | 10.0% | 12.4% | 17.4% | 20.8% | 21.9% |
| Pakistan | 0.0% | 0.0% | 0.1% | 0.1% | 0.2% | 0.3% | 0.6% | 0.7% | 0.7% | 1.9% | 3.0% | 3.9% | 5.1% | 7.7% | 13.1% | 21.4% |
| Netherlands | 0.1% | 0.1% | 0.2% | 0.4% | 0.7% | 1.0% | 1.4% | 1.9% | 3.3% | 4.5% | 7.0% | 9.3% | 13.9% | 16.3% | 17.8% | 21.1% |
| Australia | 0.4% | 0.8% | 1.0% | 1.5% | 2.0% | 2.4% | 2.9% | 3.4% | 4.7% | 6.9% | 9.0% | 11.7% | 13.8% | 16.7% | 18.3% | 20.4% |
| Greece | 0.3% | 1.0% | 2.8% | 6.5% | 7.6% | 7.6% | 7.3% | 7.3% | 7.2% | 9.2% | 9.4% | 9.7% | 13.8% | 18.2% | 19.7% | 19.6% |
| Bulgaria | 0.0% | 0.2% | 1.7% | 3.2% | 2.7% | 2.8% | 3.1% | 3.1% | 2.9% | 3.2% | 3.7% | 3.1% | 4.2% | 8.8% | 14.3% | 18.2% |
| Germany | 1.9% | 3.3% | 4.3% | 4.9% | 5.7% | 6.0% | 5.9% | 6.0% | 7.0% | 7.5% | 8.7% | 8.5% | 10.6% | 12.6% | 15.1% | 18.0% |
| Portugal | 0.4% | 0.5% | 0.9% | 1.0% | 1.2% | 1.6% | 1.5% | 1.7% | 1.7% | 2.6% | 3.3% | 4.6% | 7.6% | 11.2% | 15.0% | 17.3% |
| Italy | 0.6% | 3.6% | 6.4% | 7.5% | 8.1% | 8.2% | 7.7% | 8.3% | 7.9% | 8.2% | 9.0% | 8.8% | 10.0% | 11.7% | 13.5% | 16.8% |
| Israel | 0.1% | 0.3% | 0.6% | 0.8% | 1.4% | 1.7% | 2.3% | 2.2% | 2.3% | 4.4% | 5.6% | 7.4% | 9.2% | 11.1% | 13.1% | 16.2% |
| People's Republic of China | 0.0% | 0.1% | 0.1% | 0.2% | 0.4% | 0.7% | 1.1% | 1.8% | 2.5% | 3.0% | 3.4% | 3.8% | 4.9% | 6.2% | 8.4% | 11.2% |
| United States | 0.0% | 0.0% | 0.1% | 0.2% | 0.7% | 1.0% | 1.3% | 1.9% | 2.2% | 2.6% | 3.2% | 4.0% | 4.8% | 5.6% | 6.9% | 8.6% |
By volume the ranking is different: China generated 1,173 TWh of solar power in 2025, more than the next nine combined, but that is only 11.2% of its huge demand. The United States generated 389 TWh (8.6%) and India 195 TWh (9.4%). The ranking by installed capacity is in our world ranking of countries by solar power.
Does your company develop solar projects, batteries or transmission? Reach Energía Futura's readers.
See advertising optionsSolar power in Latin America
Chile leads Latin America by a wide margin. Second in the region is Brazil, with 11.5% of its electricity from solar (88 TWh, 18th in the world), mainly thanks to distributed rooftop generation. Next come the Dominican Republic (10%), Mexico (7%), Uruguay (5.2%) and Colombia (5.1%). Argentina and Peru are still around 3%.
| Country | Solar share 2025 | Generation (TWh) | World rank |
|---|---|---|---|
| Chile | 25.1% | 22.2 | 2 |
| Brazil | 11.5% | 88.0 | 18 |
| Dominican Republic | 10.0% | 2.3 | 26 |
| Mexico | 7.0% | 27.1 | 34 |
| Uruguay | 5.2% | 0.6 | 41 |
| Colombia | 5.1% | 4.6 | 42 |
| Argentina | 3.4% | 5.2 | 51 |
| Peru | 3.1% | 1.9 | 53 |
Source: Ember (2026). Honduras (9.5% in 2024) and Panama (7.4% in 2024) do not yet have 2025 data and are not in this year's ranking.
Chile's place among the countries with the highest share of solar power
Chile went from generating 0.7% of its electricity from the sun in 2014 to 25.1% in 2025. It is one of the fastest increases in the world: in 2021 it reached 12% and it was first in the world in 2022 and 2023, with 17.3% and 20.1%, until Hungary overtook it in 2024. According to the Generadoras de Chile bulletin for September 2026, based on National Electricity Coordinator data, the country had 13,041 MW of photovoltaic plants in operation as of July 2026, and solar supplied 28% of September's generation. On 13 September at 11:00 it covered 67.8% of demand at that moment.
View the data as a table
| Chile | Hungary | Spain | World | |
|---|---|---|---|---|
| 2010 | 0.0% | 0.0% | 2.4% | 0.2% |
| 2011 | 0.0% | 0.0% | 3.2% | 0.3% |
| 2012 | 0.0% | 0.0% | 4.1% | 0.4% |
| 2013 | 0.0% | 0.1% | 4.7% | 0.6% |
| 2014 | 0.7% | 0.2% | 5.0% | 0.8% |
| 2015 | 1.7% | 0.5% | 5.0% | 1.1% |
| 2016 | 3.3% | 0.8% | 5.0% | 1.3% |
| 2017 | 4.9% | 1.1% | 5.3% | 1.7% |
| 2018 | 6.3% | 2.0% | 4.7% | 2.2% |
| 2019 | 7.5% | 4.4% | 5.6% | 2.6% |
| 2020 | 9.0% | 7.0% | 8.0% | 3.2% |
| 2021 | 12.0% | 10.5% | 10.0% | 3.7% |
| 2022 | 17.3% | 13.2% | 12.4% | 4.6% |
| 2023 | 20.1% | 19.5% | 17.4% | 5.6% |
| 2024 | 22.8% | 24.2% | 20.8% | 7.0% |
| 2025 | 25.1% | 27.1% | 21.9% | 8.8% |
Solar generation is concentrated in the north: Antofagasta contributes 40% and Atacama 22%, according to the same bulletin. The challenge is getting that energy to the centre of the country: part of it is lost for lack of transmission lines, as we reported in our story on the 6,205 GWh curtailed in 2025. The batteries being installed next to solar plants aim to store that energy for the night.
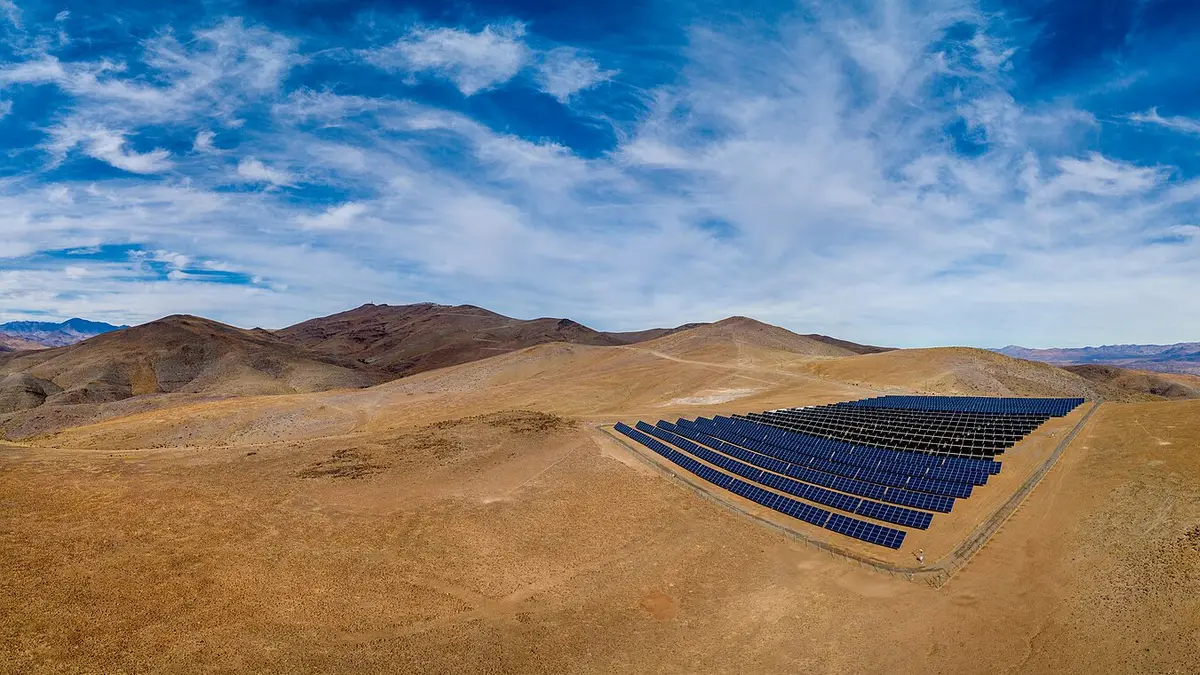
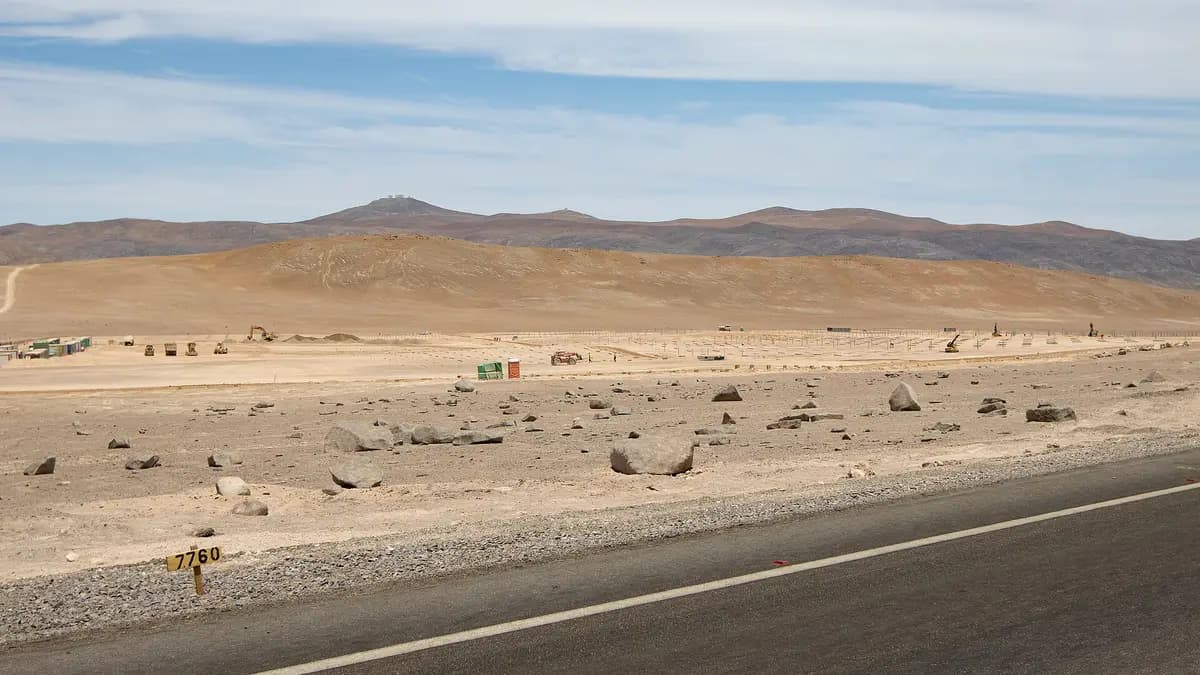
The underlying reason for Chile's lead is the resource: the Atacama Desert has some of the highest solar radiation on the planet, clear skies almost all year and large flat sites near the grid and the mines, which buy much of that energy under long-term contracts. That is why several of Latin America's largest plants are in Chile, though still far from the Chinese and Indian giants in our ranking of the largest solar plant in the world.
Methodology
The data come from Ember, which compiles official electricity generation statistics by country (national agencies, Eurostat, the US EIA and the IEA, among others), from its annual dataset downloaded on 16 November 2026. The ranking uses 2025 and covers the 81 countries that generate at least 10 TWh a year and already have 2025 data, so that very small countries do not distort the comparison. Among those generating over 10 TWh, 27 countries do not yet have 2025 data, including Jordan, which generated 16.6% of its electricity from the sun in 2024 and would have been close to the top 10, Iraq, Algeria and Venezuela. The solar category includes photovoltaics (utility-scale and rooftop, as estimated by each country) and solar thermal. Chile's MW figures are from the CNE via Generadoras de Chile and may differ from Ember's GW estimates.
How to cite this data
Energía Futura (2026). "Countries with the highest share of solar power in electricity 2026: world ranking and Chile's place". Updated on 16 November 2026. energiafutura.cl/en/news/countries-with-the-highest-share-of-solar-power-in-electricity-2026-world-ranking-and-chile. Data: Ember (2026), Yearly Electricity Data.
Frequently asked questions
In which country does solar weigh most in electricity?
Hungary, which generated 27.1% of its electricity from the sun in 2025, according to Ember, among countries generating at least 10 TWh a year.
Where does Chile rank?
Second in the world, with 25.1% in 2025 (22.2 TWh). It was also second in 2024, with 22.8%, and first in 2022 and 2023.
How much of the world's electricity comes from solar?
8.8% in 2025, with 2,807 TWh. In 2015 it was just 1.1%.
Which country generates the most solar power?
China, with 1,173 TWh in 2025, although that is only 11.2% of its electricity.
Which Latin American country has the most solar in its power mix?
Chile, with 25.1%, followed by Brazil (11.5%) and the Dominican Republic (10%).
Was Chile ever first in the ranking?
Yes: according to Ember, Chile was the country where solar weighed most in electricity in 2022 (17.3%) and 2023 (20.1%). Hungary overtook it in 2024.
How many countries generate more than 10% of their electricity from the sun?
25 countries in 2025, out of the 81 that generate at least 10 TWh and have data for that year. Six of them exceed 20%.