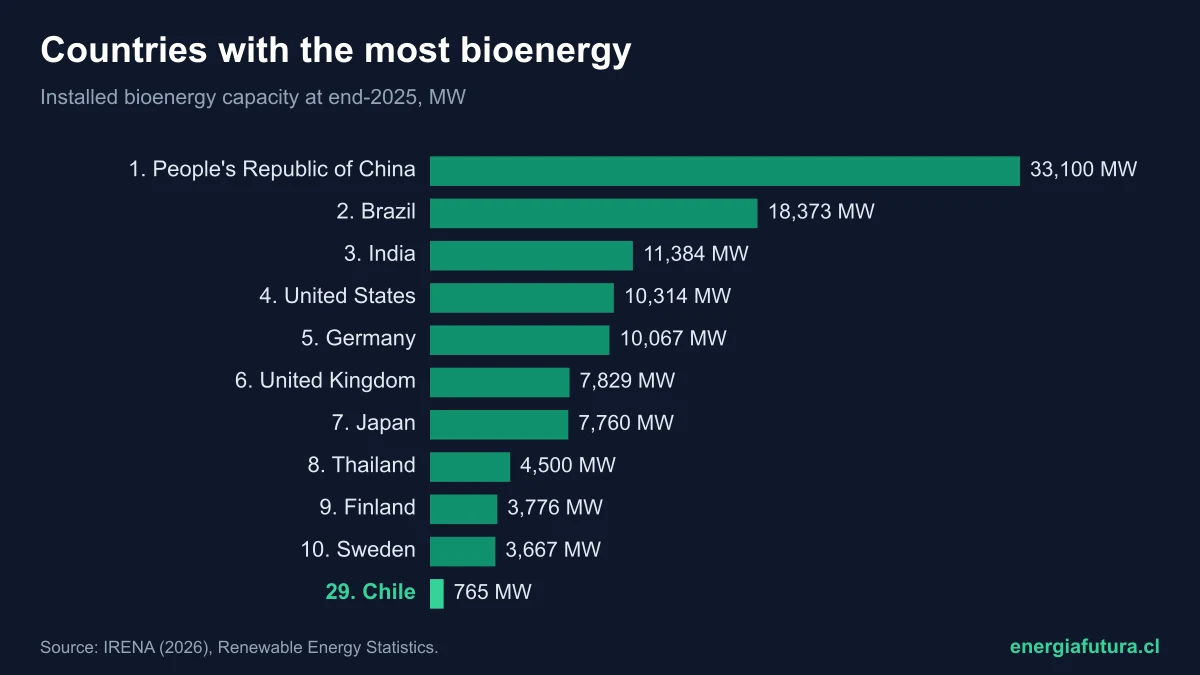
Updated on 15 November 2026. China is the country with the most bioenergy in the world: it had 33,100 MW of plants generating electricity from biomass, waste and biogas at the end of 2025, 21% of world capacity, according to the statistics of the International Renewable Energy Agency (IRENA). It is followed by Brazil, with 18,373 MW, and India, with 11,384 MW. Chile ranks 29th, with 765 MW.
Worldwide there were 155,364 MW of bioenergy at the end of 2025, 63% more than in 2015, and those plants generated 660 TWh in 2024, more than seven times all of Chile's electricity. Even so, bioenergy supplies only about 2% of the planet's electricity, according to Ember. This data sheet brings together the ranking of countries with the most bioenergy, who generates the most, what each country's bioenergy is made of, where Latin America stands and how it has grown since 2015.
View the data as a table
| World capacity at end-2025 | 155,364 MW |
| Electricity generated in 2024 | 660 TWh |
| China, the leader | 33,100 MW |
| Chile, ranked 29th | 765 MW |
Ranking of the countries with the most bioenergy
The table ranks countries by installed bioenergy capacity for power generation at the end of 2025, the sum of IRENA's four categories: solid biofuels, renewable waste, biogas and liquid biofuels. The last column shows the electricity they generated in 2024, the latest full year.
| # | Country | Capacity 2025 (MW) | Capacity 2015 (MW) | Generation 2024 (TWh) |
|---|---|---|---|---|
| 1 | China | 33,100 | 7,977 | 146.3 |
| 2 | Brazil | 18,373 | 14,079 | 61.1 |
| 3 | India | 11,384 | 5,478 | 25.4 |
| 4 | United States | 10,314 | 12,969 | 50.9 |
| 5 | Germany | 10,067 | 8,429 | 51.1 |
| 6 | United Kingdom | 7,829 | 4,808 | 40.3 |
| 7 | Japan | 7,760 | 1,319 | 43.0 |
| 8 | Thailand | 4,500 | 3,165 | 27.3 |
| 9 | Finland | 3,776 | 1,912 | 10.4 |
| 10 | Sweden | 3,667 | 4,716 | 10.2 |
| 29 | Chile | 765 | 466 | 6.1 |
Source: IRENA (2026), Renewable Energy Statistics, second-half 2026 update. World totals summed by Energía Futura from the countries in the database.
China's leap explains much of the world's growth: in 2015 it had 7,977 MW and today it has four times that, with plants burning straw and farm residues and, increasingly, municipal waste. Japan is the other big accelerator: it went from 1,319 MW to 7,760 MW in ten years, with plants that import pellets and palm kernel shells. In the opposite direction, the United States fell from 12,969 MW to 10,314 MW as old biomass plants closed.
View the data as a table
| People's Republic of China | 33,100 MW |
| Brazil | 18,373 MW |
| India | 11,384 MW |
| United States | 10,314 MW |
| Germany | 10,067 MW |
| United Kingdom | 7,829 MW |
| Japan | 7,760 MW |
| Thailand | 4,500 MW |
| Finland | 3,776 MW |
| Sweden | 3,667 MW |
| South Korea | 3,503 MW |
| Italy | 3,403 MW |
| Indonesia | 3,203 MW |
| Canada | 2,708 MW |
| France | 2,217 MW |
| Türkiye | 1,999 MW |
| Denmark | 1,961 MW |
| Spain | 1,314 MW |
| Poland | 1,215 MW |
| Austria | 1,176 MW |
| Estonia | 987 MW |
| Malaysia | 945 MW |
| Mexico | 890 MW |
| Netherlands | 874 MW |
| Guatemala | 870 MW |
| Czech Republic | 853 MW |
| Australia | 827 MW |
| Philippines | 815 MW |
| Chile | 765 MW |
| Uruguay | 737 MW |
| Belgium | 730 MW |
| Portugal | 705 MW |
| Hungary | 635 MW |
| Ukraine | 530 MW |
| Vietnam | 497 MW |
| Reunion | 455 MW |
| Cuba | 440 MW |
| Argentina | 435 MW |
| Pakistan | 432 MW |
| Colombia | 422 MW |
| Taiwan | 417 MW |
| Slovakia | 348 MW |
| Ethiopia | 335 MW |
| El Salvador | 305 MW |
| Switzerland | 275 MW |
| Bolivia | 265 MW |
| South Africa | 265 MW |
| Honduras | 251 MW |
| Peru | 236 MW |
| Singapore | 230 MW |
| Nicaragua | 218 MW |
| Ireland | 205 MW |
| Sudan | 199 MW |
| Lithuania | 199 MW |
| Greece | 185 MW |
| Kenya | 174 MW |
| Ecuador | 167 MW |
| Romania | 159 MW |
| Croatia | 157 MW |
| Russia | 157 MW |
| New Zealand | 134 MW |
| Egypt | 131 MW |
| Lao People's Democratic Republic | 123 MW |
| Uganda | 113 MW |
| Latvia | 112 MW |
| Eswatini | 106 MW |
| Panama | 103 MW |
| Belarus | 101 MW |
| Zimbabwe | 100 MW |
| Luxembourg | 93 MW |
| Norway | 92 MW |
| Bulgaria | 91 MW |
| Mauritius | 91 MW |
| Dominican Republic | 83 MW |
| Costa Rica | 81 MW |
| Mozambique | 75 MW |
| Cambodia | 73 MW |
| United Republic of Tanzania | 70 MW |
| Slovenia | 67 MW |
| Fiji | 66 MW |
| Serbia | 62 MW |
| Hong Kong | 62 MW |
| Myanmar | 59 MW |
| Venezuela | 56 MW |
| Angola | 51 MW |
| Guadeloupe | 51 MW |
| Sri Lanka | 49 MW |
| Senegal | 49 MW |
| Martinique | 46 MW |
| Israel | 46 MW |
| Bangladesh | 45 MW |
| Guyana | 45 MW |
| Zambia | 43 MW |
| Mali | 41 MW |
| Azerbaijan | 38 MW |
| Belize | 36 MW |
| Sierra Leone | 34 MW |
| Jamaica | 32 MW |
| Paraguay | 22 MW |
| Iran | 22 MW |
| Nigeria | 21 MW |
| Qatar | 19 MW |
| Malawi | 19 MW |
| Papua New Guinea | 18 MW |
| French Guiana | 17 MW |
| The Republic of North Macedonia | 13 MW |
| Jordan | 13 MW |
| DR Congo | 13 MW |
| Republic of the Congo | 12 MW |
| Cyprus | 11 MW |
| Burkina Faso | 11 MW |
| Bosnia and Herzegovina | 10 MW |
| Ghana | 8 MW |
| Morocco | 7 MW |
| Moldova, Republic of | 7 MW |
| Nepal | 7 MW |
| Lebanon | 7 MW |
| Syrian Arab Republic | 7 MW |
| Andorra | 5 MW |
| Puerto Rico | 5 MW |
| Malta | 4 MW |
| Burundi | 4 MW |
| Vanuatu | 3 MW |
| Chad | 2 MW |
| Kazakhstan | 2 MW |
| Faroe Islands | 2 MW |
| Suriname | 2 MW |
| New Caledonia | 1 MW |
| Albania | 1 MW |
| Namibia | 1 MW |
| Gabon | 1 MW |
| Aruba | 1 MW |
| Bahamas | 1 MW |
| Rwanda | 1 MW |
| Solomon Islands | 1 MW |
| Samoa | 1 MW |
| Greenland | 1 MW |
| State of Palestine | 0 MW |
| Maldives | 0 MW |
| Madagascar | 0 MW |
| Liberia | 0 MW |
| Saint Lucia | 0 MW |
| Georgia | 0 MW |
| Yemen | 0 MW |
The countries that generate the most electricity from bioenergy
By electricity generated, the order changes slightly. China generated 146.3 TWh in 2024, more than twice Brazil (61.1 TWh). Next come Germany (51.1 TWh) and the United States (50.9 TWh), almost tied, and Japan (43 TWh). Chile ranks 21st, with 6.1 TWh, ahead of countries with more capacity, because its plants run many hours a year alongside the forestry industry.
What each country's bioenergy is made of
The word bioenergy covers very different fuels. Worldwide, solid biofuels (wood, pellets, sugarcane bagasse, husks and farm residues) generated 448 TWh in 2024, 68% of the total. Renewable waste, the organic fraction of rubbish burned in energy-from-waste plants, contributed 106 TWh (16%), and biogas, obtained by fermenting manure, sludge or crops, 98 TWh (15%). Liquid biofuels are hardly used for power: 7.5 TWh.
View the data as a table
| Solid biofuels | Renewable waste | Biogas | Liquid biofuels | |
|---|---|---|---|---|
| People's Republic of China | 77,400 | 62,000 | 6,900 | 0 |
| Brazil | 58,090 | 48 | 2,821 | 95 |
| Germany | 10,689 | 5,647 | 34,565 | 183 |
| United States | 35,290 | 6,333 | 9,016 | 213 |
| Japan | 40,591 | 2,449 | 7 | 0 |
| United Kingdom | 27,212 | 5,463 | 7,433 | 144 |
| Italy | 3,975 | 2,414 | 7,496 | 3,352 |
| Chile | 6,064 | 0 | 51 | 0 |
Each country has its own recipe. In Brazil, 95% of bioenergy power is solid biomass, almost all sugarcane bagasse burned by mills to produce steam and electricity. In Germany, by contrast, biogas dominates: 34.6 of its 51.1 TWh (68%) come from thousands of farm digesters. In China, municipal waste generates 62 TWh, 42% of its bioenergy. In Chile, 99% of bioenergy generation is solid biomass.
| Bioenergy type | World capacity 2025 (MW) | World generation 2024 (TWh) | % of generation |
|---|---|---|---|
| Solid biofuels | 108,250 | 448.3 | 67.9% |
| Renewable waste | 23,517 | 106.4 | 16.1% |
| Biogas | 21,583 | 98.0 | 14.8% |
| Liquid biofuels | 2,015 | 7.5 | 1.1% |
| Total | 155,364 | 660.2 | 100% |
Source: IRENA (2026), Renewable Energy Statistics. Sums and shares calculated by Energía Futura.
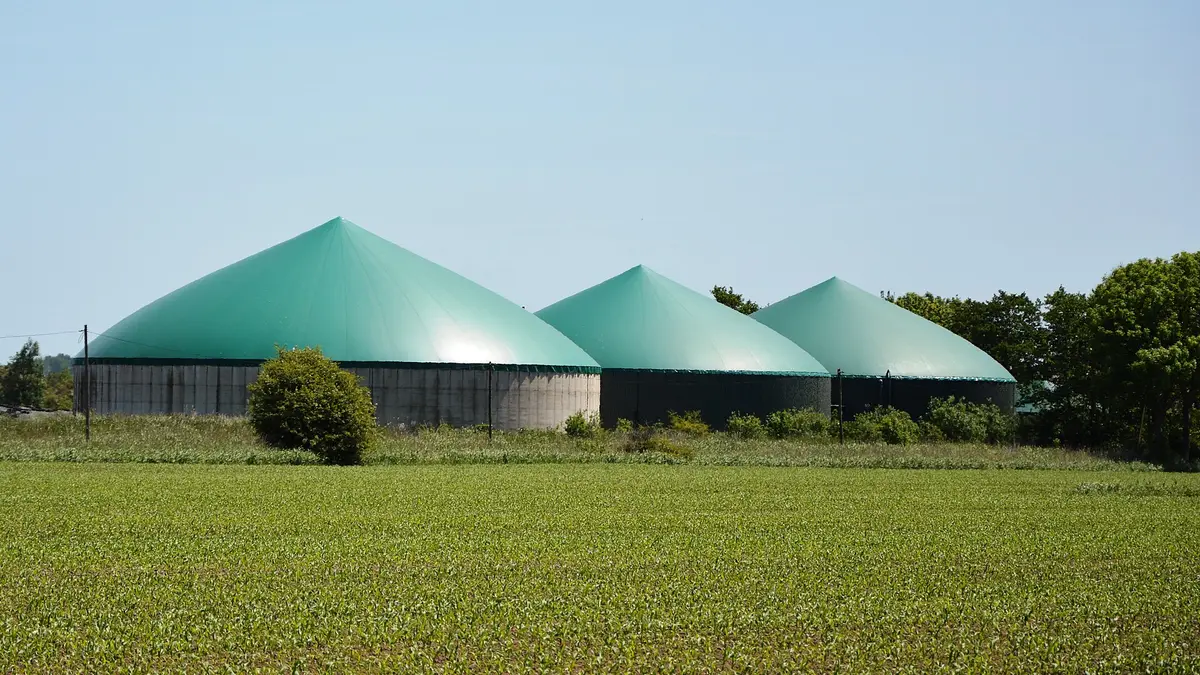
Where bioenergy weighs most in electricity
Measured as a share of each country's electricity, among those generating at least 10 TWh a year, bioenergy weighs most in Uruguay (22.4%), where pulp mills generate from their own residues, and Guatemala (22.2%), thanks to bagasse from its sugar mills. They are followed by Denmark (20.1%), the United Kingdom (14.1%), which converted its largest coal plant to burn pellets, and Thailand (13%). Chile generates 5.6% of its electricity from bioenergy, according to Ember.
Does your company work in biomass, biogas, waste-to-energy or energy efficiency? Reach Energía Futura's readers.
See advertising optionsHow bioenergy has grown since 2015
World bioenergy capacity went from 95,444 MW in 2015 to 155,364 MW in 2025. Growth was fast until 2021 and then slowed to around 3,000 to 7,000 MW a year, far below what solar and wind add each year. The reason is that bioenergy depends on having fuel nearby at a good price, which does not scale the way a panel does.
View the data as a table
| People's Republic of China | Brazil | India | United States | Germany | Japan | |
|---|---|---|---|---|---|---|
| 2015 | 7,977 | 14,079 | 5,478 | 12,969 | 8,429 | 1,319 |
| 2020 | 21,855 | 15,713 | 10,533 | 11,894 | 10,320 | 3,324 |
| 2021 | 27,345 | 16,378 | 10,592 | 11,339 | 9,792 | 3,976 |
| 2022 | 29,390 | 17,229 | 10,669 | 11,106 | 9,830 | 5,280 |
| 2023 | 31,255 | 17,485 | 10,752 | 10,842 | 9,860 | 5,809 |
| 2024 | 32,300 | 17,807 | 11,237 | 10,466 | 9,935 | 6,685 |
| 2025 | 33,100 | 18,373 | 11,384 | 10,314 | 10,067 | 7,760 |
The bioenergy ranking differs from other renewables: countries that lead in sun or wind, such as Australia or Spain, are far behind here, while nations with agribusiness or forests, like Brazil, Finland, Sweden or Thailand, rise. The comparison with all clean sources is in our ranking of countries with the most renewable energy.
Bioenergy in Latin America
Brazil holds almost all of the region's bioenergy: its 18,373 MW are nearly three times the sum of all other Latin American countries (about 6,460 MW). Next come Mexico (890 MW), Guatemala (870 MW), Chile (765 MW) and Uruguay (737 MW). In electricity generated, Chile is second in Latin America, with 6.1 TWh in 2024, behind Brazil and ahead of Uruguay (4.4 TWh) and Argentina (4.1 TWh).
| Country | Capacity 2025 (MW) | Generation 2024 (TWh) | World rank (capacity) |
|---|---|---|---|
| Brazil | 18,373 | 61.1 | 2 |
| Mexico | 890 | 1.1 | 23 |
| Guatemala | 870 | 2.6 | 25 |
| Chile | 765 | 6.1 | 29 |
| Uruguay | 737 | 4.4 | 30 |
| Cuba | 440 | 0.2 | 36 |
| Argentina | 435 | 4.1 | 37 |
| Colombia | 422 | 1.9 | 39 |
Source: IRENA (2026), Renewable Energy Statistics.
Chile's place in bioenergy
Chile had 765 MW of bioenergy at the end of 2025, 29th in the world, according to IRENA. The figure jumped from 521 MW in 2024, a 47% rise in one year almost entirely in solid biomass (706 MW); the rest is 58 MW of biogas plants. The National Energy Commission records 841 MW of bioenergy in the National Electricity System in July 2026, 40.9% more than a year earlier, according to the Generadoras de Chile bulletin. The gap between the two sources is due to different criteria and cut-off dates.
View the data as a table
| Chile | |
|---|---|
| 2015 | 466 |
| 2020 | 454 |
| 2021 | 490 |
| 2022 | 490 |
| 2023 | 521 |
| 2024 | 521 |
| 2025 | 765 |
Most of Chile's bioenergy is linked to the forestry and pulp industry in the centre-south, which burns bark, sawdust and black liquor to produce steam and electricity, and sells the surplus to the grid. In homes, biomass is used mainly for heating: what it costs to heat with pellets is calculated in our guide to pellet stoves.
Bioenergy generation in Chile has stayed between 4.6 and 6.1 TWh a year since 2015, while solar went from 1.2 to over 22 TWh, according to Ember. That is why its share of the mix fell from 7.5% to about 5.6%. Its advantage is that it generates day and night, like hydropower, whose country comparison is in our ranking of countries with the most hydropower.
| 1 | People's Republic of China | 33,100 | 7,977 | 146.30 |
| 2 | Brazil | 18,373 | 14,079 | 61.05 |
| 3 | India | 11,384 | 5,478 | 25.40 |
| 4 | United States | 10,314 | 12,969 | 50.85 |
| 5 | Germany | 10,067 | 8,429 | 51.08 |
| 6 | United Kingdom | 7,829 | 4,808 | 40.25 |
| 7 | Japan | 7,760 | 1,319 | 43.05 |
| 8 | Thailand | 4,500 | 3,165 | 27.27 |
| 9 | Finland | 3,776 | 1,912 | 10.39 |
| 10 | Sweden | 3,667 | 4,716 | 10.18 |
| 11 | South Korea | 3,503 | 729 | 11.75 |
| 12 | Italy | 3,403 | 3,367 | 17.24 |
| 13 | Indonesia | 3,203 | 1,734 | 21.33 |
| 14 | Canada | 2,708 | 2,554 | 10.17 |
| 15 | France | 2,217 | 1,521 | 11.44 |
| 16 | Turkey | 1,999 | 271 | 9.33 |
| 17 | Denmark | 1,961 | 1,243 | 7.40 |
| 18 | Spain | 1,314 | 1,035 | 6.17 |
| 19 | Poland | 1,215 | 961 | 7.95 |
| 20 | Austria | 1,176 | 1,396 | 4.67 |
| 21 | Estonia | 987 | 281 | 1.34 |
| 22 | Malaysia | 945 | 1,555 | 4.12 |
| 23 | Mexico | 890 | 725 | 1.10 |
| 24 | Netherlands | 874 | 792 | 6.68 |
| 25 | Guatemala | 870 | 878 | 2.59 |
| 26 | Czechia | 853 | 771 | 5.38 |
| 27 | Australia | 827 | 826 | 3.30 |
| 28 | Philippines | 815 | 295 | 1.53 |
| 29 | Chile | 765 | 466 | 6.12 |
| 30 | Uruguay | 737 | 417 | 4.44 |
| 31 | Belgium | 730 | 943 | 3.61 |
| 32 | Portugal | 705 | 577 | 3.85 |
| 33 | Hungary | 635 | 519 | 1.83 |
| 34 | Ukraine | 530 | 53 | 1.86 |
| 35 | Vietnam | 497 | 220 | 1.23 |
| 36 | Reunion | 455 | 45 | 2.07 |
| 37 | Cuba | 440 | 440 | 0.23 |
| 38 | Argentina | 435 | 219 | 4.14 |
| 39 | Pakistan | 432 | 333 | 0.96 |
| 40 | Colombia | 422 | 237 | 1.88 |
| 41 | Taiwan | 417 | 395 | 2.06 |
| 42 | Slovakia | 348 | 242 | 1.58 |
| 43 | Ethiopia | 335 | 119 | 0.05 |
| 44 | El Salvador | 305 | 202 | 0.81 |
| 45 | Switzerland | 275 | 272 | 2.18 |
| 46 | Bolivia | 265 | 116 | 0.42 |
| 47 | South Africa | 265 | 251 | 0.38 |
| 48 | 254 | 1 | 1.32 | |
| 49 | Honduras | 251 | 169 | 0.69 |
| 50 | Peru | 236 | 197 | 0.56 |
| 51 | Singapore | 230 | 168 | 0.95 |
| 52 | Nicaragua | 218 | 134 | 0.93 |
| 53 | Ireland | 205 | 55 | 1.00 |
| 54 | Sudan | 199 | 199 | 0.09 |
| 55 | Lithuania | 199 | 71 | 0.98 |
| 56 | Greece | 185 | 51 | 0.71 |
| 57 | Kenya | 174 | 58 | 0.19 |
| 58 | Ecuador | 167 | 144 | 0.50 |
| 59 | Romania | 159 | 118 | 0.48 |
| 60 | Croatia | 157 | 53 | 1.00 |
| 61 | Russia | 157 | 39 | 0.39 |
| 62 | New Zealand | 134 | 149 | 0.80 |
| 63 | Egypt | 131 | 67 | 0.43 |
| 64 | Laos | 123 | 40 | 0.51 |
| 65 | Uganda | 113 | 65 | 0.49 |
| 66 | Latvia | 112 | 126 | 0.62 |
| 67 | Eswatini | 106 | 106 | 0.18 |
| 68 | Panama | 103 | 60 | 0.23 |
| 69 | Belarus | 101 | 35 | 0.55 |
| 70 | Zimbabwe | 100 | 100 | 0.17 |
| 71 | Luxembourg | 93 | 24 | 0.44 |
| 72 | Norway | 92 | 140 | 0.24 |
| 73 | Bulgaria | 91 | 54 | 1.72 |
| 74 | Mauritius | 91 | 91 | 0.31 |
| 75 | Dominican Republic | 83 | 20 | 0.49 |
| 76 | Costa Rica | 81 | 49 | 0.08 |
| 77 | Mozambique | 75 | 73 | 0.07 |
| 78 | Cambodia | 73 | 58 | 0.13 |
| 79 | Tanzania | 70 | 68 | 0.16 |
| 80 | Slovenia | 67 | 63 | 0.26 |
| 81 | Fiji | 66 | 47 | 0.10 |
| 82 | Serbia | 62 | 6 | 0.34 |
| 83 | Hong Kong | 62 | 0 | 0.15 |
| 84 | Myanmar | 59 | 48 | 0.26 |
| 85 | Venezuela | 56 | 10 | 0.06 |
| 86 | Angola | 51 | 51 | 0.20 |
| 87 | Guadeloupe | 51 | 31 | 0.20 |
Methodology
Capacity and generation come from IRENASTAT, IRENA's statistics database, in its second-half 2026 update (capacity at end-2025 and generation for 2024). Bioenergy is the sum of solid biofuels, renewable waste, biogas and liquid biofuels; it excludes transport biofuels and firewood for heating. The world total is the sum of the 144 countries with capacity in the database. Each country's share of electricity comes from Ember (2024). Chile's capacity according to the CNE comes from the Generadoras de Chile September 2026 bulletin.
How to cite this data
Energía Futura (2026). "Countries with the most bioenergy 2026: world ranking and Chile's place". Updated on 15 November 2026. energiafutura.cl/en/news/countries-with-the-most-bioenergy-2026-world-ranking-and-chile. Data: IRENA (2026), Renewable Energy Statistics, and Ember (2026).
Frequently asked questions
Which country has the most bioenergy?
China, with 33,100 MW at the end of 2025, 21% of world capacity, according to IRENA. It is also the largest generator of bioenergy electricity: 146.3 TWh in 2024.
How much bioenergy is there in the world?
155,364 MW of capacity at the end of 2025, which generated 660 TWh in 2024, about 2% of world electricity.
Where does Chile rank in bioenergy?
29th by capacity (765 MW) and 21st by generation (6.1 TWh in 2024). It is second in Latin America in electricity generated from bioenergy, behind Brazil.
What are solid biofuels?
Organic matter burned in boilers to produce steam and electricity: wood, pellets, bark, sugarcane bagasse and farm residues. They generate 68% of the world's bioenergy power.
Which country depends most on bioenergy for its electricity?
Uruguay, which generated 22.4% of its electricity from bioenergy in 2024, followed by Guatemala (22.2%) and Denmark (20.1%), among countries generating at least 10 TWh a year.