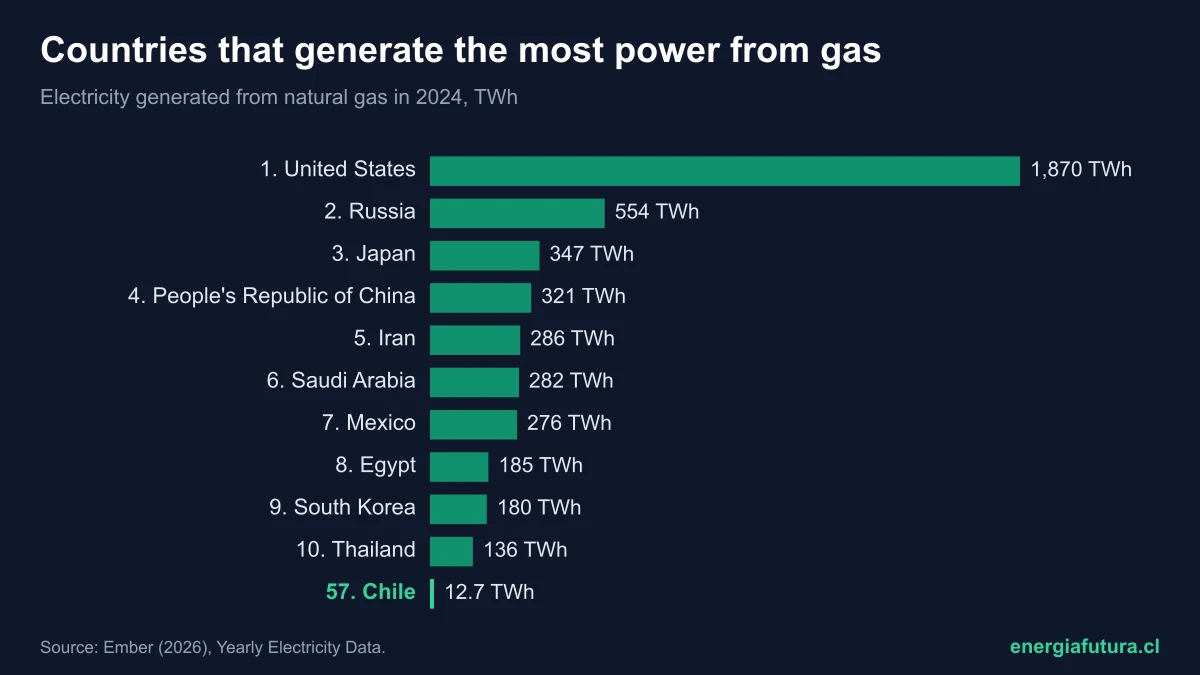
Updated on 15 November 2026. The United States is the country that generates the most electricity from natural gas: 1,870 TWh in 2024, 27.1% of all gas-fired electricity in the world and 42.6% of its own generation, according to the annual data of Ember, the British think tank that compiles each country's official statistics. It is followed by Russia, with 553.5 TWh, and Japan, with 347 TWh. Chile ranks 57th, with 12.7 TWh, 14.3% of its electricity.
The world generated 6,893 TWh from natural gas in 2024, 22.2% of all its electricity: the second-largest source after coal. The preliminary 2025 figure barely rises to 6,922 TWh (+0.4%), but gas's share falls to 21.7%, the lowest since 2008, because solar and wind are growing faster. This data sheet brings together the ranking of the countries that generate the most electricity from natural gas, who depends most on it, where Latin America stands and how the series has changed since 2000.
View the data as a table
| World gas-fired generation in 2024 | 6,893 TWh |
| United States, the leader | 1,870 TWh |
| Chile, ranked 57th | 12.7 TWh |
| Preliminary 2025 figure | 6,922 TWh |
Ranking of the countries that generate the most electricity from natural gas
The table ranks countries by gas-fired generation in 2024, the latest year with complete data for all of them. The fourth column shows what share of each country's electricity comes from gas, and the last one the preliminary 2025 figure, which Ember already has for 94 countries.
| # | Country | Gas-fired generation 2024 (TWh) | % of its electricity | 2025 preliminary (TWh) |
|---|---|---|---|---|
| 1 | United States | 1,869.9 | 42.6% | 1,807.3 |
| 2 | Russia | 553.5 | 45.8% | 545.0 |
| 3 | Japan | 347.0 | 34.2% | 336.3 |
| 4 | China | 320.7 | 3.2% | 337.6 |
| 5 | Iran | 286.0 | 72.3% | 292.2 |
| 6 | Saudi Arabia | 282.1 | 61.5% | 300.4 |
| 7 | Mexico | 275.5 | 71.0% | 272.9 |
| 8 | Egypt | 185.1 | 78.1% | 184.4 |
| 9 | South Korea | 180.4 | 28.7% | 176.0 |
| 10 | Thailand | 136.4 | 62.8% | 123.3 |
| 57 | Chile | 12.7 | 14.3% | 13.5 |
Source: Ember (2026), Yearly Electricity Data. Shares of the world total calculated by Energía Futura.
Concentration is high: the top 10 generate 64.4% of the planet's gas-fired electricity. The United States generates more than the next four combined and has tripled its output since 2000, when it produced 615 TWh, thanks to shale gas, which made the fuel cheaper and displaced coal. China is a different case: it ranks fourth by volume, but gas supplies only 3.2% of its electricity, because its system is so large that coal and renewables weigh far more.
In total, 115 countries generated electricity from natural gas in 2024, out of the 191 with data in Ember. World gas power capacity reached 2,037 GW, of which 546 GW are in the United States and 139 GW in China. How much coal weighs in those same countries can be seen in our ranking of the countries that generate the most electricity from coal.
View the data as a table
| Turkmenistan | 100.0% · 33 TWh |
| Bahrain | 99.7% · 37.9 TWh |
| Trinidad and Tobago | 99.5% · 9.5 TWh |
| Algeria | 98.6% · 95 TWh |
| Qatar | 96.0% · 54.4 TWh |
| Tunisia | 94.5% · 20.2 TWh |
| Singapore | 92.2% · 54.9 TWh |
| Oman | 91.2% · 44.8 TWh |
| Azerbaijan | 88.0% · 24.5 TWh |
| Moldova, Republic of | 85.7% · 5.2 TWh |
| Malta | 84.0% · 1.8 TWh |
| Brunei Darussalam | 79.1% · 4.4 TWh |
| Egypt | 78.1% · 185.1 TWh |
| Uzbekistan | 75.2% · 61.3 TWh |
| Nigeria | 75.0% · 28.2 TWh |
| Libya | 74.5% · 25.8 TWh |
| Republic of the Congo | 73.8% · 4 TWh |
| Equatorial Guinea | 72.5% · 1.1 TWh |
| Iran | 72.3% · 286 TWh |
| Benin | 72.3% · 0.7 TWh |
| Israel | 71.4% · 57.4 TWh |
| Mexico | 71.0% · 275.5 TWh |
| Cote d'Ivoire | 70.9% · 7.7 TWh |
| United Arab Emirates | 69.3% · 124.3 TWh |
| Bangladesh | 65.9% · 67 TWh |
| Bolivia | 64.5% · 8.7 TWh |
| Hong Kong | 64.1% · 24 TWh |
| Thailand | 62.8% · 136.4 TWh |
| United Republic of Tanzania | 62.8% · 5.6 TWh |
| Kuwait | 62.1% · 57.4 TWh |
| Jordan | 62.0% · 14.7 TWh |
| Saudi Arabia | 61.5% · 282.1 TWh |
| Ghana | 61.4% · 14.9 TWh |
| Belarus | 58.9% · 27 TWh |
| Jamaica | 56.9% · 2.8 TWh |
| Argentina | 54.1% · 82.9 TWh |
| Iraq | 53.0% · 79.3 TWh |
| Syrian Arab Republic | 52.3% · 13 TWh |
| Ireland | 48.6% · 15.1 TWh |
| Myanmar | 46.1% · 10 TWh |
| Russia | 45.8% · 553.5 TWh |
| Italy | 44.3% · 118.6 TWh |
| Gabon | 44.2% · 1.2 TWh |
| Taiwan | 43.2% · 125 TWh |
| United States | 42.6% · 1,869.9 TWh |
| Peru | 39.2% · 23.2 TWh |
| Armenia | 39.0% · 3.5 TWh |
| Greece | 37.7% · 21.5 TWh |
| Netherlands | 36.2% · 44.3 TWh |
| Malaysia | 35.6% · 75.2 TWh |
| Japan | 34.2% · 347 TWh |
| United Kingdom | 30.3% · 86.3 TWh |
| Dominican Republic | 29.1% · 7 TWh |
| South Korea | 28.7% · 180.4 TWh |
| Pakistan | 28.0% · 42.3 TWh |
| Puerto Rico | 27.0% · 5.4 TWh |
| Latvia | 26.5% · 1.7 TWh |
| Rwanda | 26.5% · 0.3 TWh |
| Kazakhstan | 26.2% · 31.1 TWh |
| Cameroon | 22.0% · 1.6 TWh |
| Croatia | 21.3% · 3.3 TWh |
| Colombia | 20.8% · 18.6 TWh |
| Panama | 20.8% · 2.8 TWh |
| The Republic of North Macedonia | 20.5% · 1.3 TWh |
| Georgia | 20.2% · 2.8 TWh |
| Papua New Guinea | 19.2% · 0.9 TWh |
| Canada | 18.9% · 121.3 TWh |
| Hungary | 18.8% · 7.1 TWh |
| Belgium | 18.7% · 14.2 TWh |
| Spain | 18.6% · 52.3 TWh |
| Türkiye | 18.5% · 63.3 TWh |
| Romania | 17.4% · 9.2 TWh |
| Australia | 17.2% · 48.8 TWh |
| Germany | 15.9% · 78.4 TWh |
| Mozambique | 15.8% · 3.1 TWh |
| Philippines | 14.5% · 18.1 TWh |
| Chile | 14.3% · 12.7 TWh |
| Indonesia | 14.1% · 71.7 TWh |
| Cuba | 13.6% · 2.7 TWh |
| Poland | 11.9% · 20.5 TWh |
| Portugal | 11.9% · 5.6 TWh |
| Lithuania | 11.4% · 0.8 TWh |
| Morocco | 10.2% · 4.3 TWh |
| New Zealand | 9.8% · 4.3 TWh |
| Slovakia | 9.8% · 2.9 TWh |
| Austria | 9.6% · 7.5 TWh |
| Angola | 9.0% · 1.4 TWh |
| Vietnam | 7.0% · 21.8 TWh |
| Brazil | 6.4% · 47.8 TWh |
| Bulgaria | 5.3% · 2 TWh |
| Czech Republic | 5.2% · 3.8 TWh |
| Serbia | 4.7% · 1.7 TWh |
| Luxembourg | 4.6% · 0.1 TWh |
| Venezuela | 4.5% · 3.6 TWh |
| People's Republic of China | 3.2% · 320.7 TWh |
| France | 3.2% · 18.1 TWh |
| Ecuador | 2.9% · 1 TWh |
| Slovenia | 2.9% · 0.5 TWh |
| India | 2.8% · 56.4 TWh |
| Barbados | 2.7% · 0 TWh |
| Denmark | 2.6% · 0.9 TWh |
| Estonia | 1.3% · 0.1 TWh |
| Kyrgyzstan | 1.2% · 0.2 TWh |
| Yemen | 1.1% · 0.1 TWh |
| Suriname | 1.1% · 0 TWh |
| Finland | 1.0% · 0.8 TWh |
| Norway | 0.9% · 1.5 TWh |
| Tajikistan | 0.9% · 0.2 TWh |
| Guyana | 0.7% · 0 TWh |
| Switzerland | 0.3% · 0.3 TWh |
| Senegal | 0.3% · 0 TWh |
| Sweden | 0.1% · 0.1 TWh |
| Albania | 0.0% · 0 TWh |
| Aruba | 0.0% · 0 TWh |
| Bahamas | 0.0% · 0 TWh |
| Bhutan | 0.0% · 0 TWh |
| Bosnia and Herzegovina | 0.0% · 0 TWh |
| Botswana | 0.0% · 0 TWh |
| Burkina Faso | 0.0% · 0 TWh |
| DR Congo | 0.0% · 0 TWh |
| Costa Rica | 0.0% · 0 TWh |
| Cyprus | 0.0% · 0 TWh |
| Ethiopia | 0.0% · 0 TWh |
| Fiji | 0.0% · 0 TWh |
| Guam | 0.0% · 0 TWh |
| Guatemala | 0.0% · 0 TWh |
| Guinea | 0.0% · 0 TWh |
| Honduras | 0.0% · 0 TWh |
| Iceland | 0.0% · 0 TWh |
| Kenya | 0.0% · 0 TWh |
| Lao People's Democratic Republic | 0.0% · 0 TWh |
| Lebanon | 0.0% · 0 TWh |
| Madagascar | 0.0% · 0 TWh |
| Malawi | 0.0% · 0 TWh |
| Mali | 0.0% · 0 TWh |
| Mauritania | 0.0% · 0 TWh |
| Mauritius | 0.0% · 0 TWh |
| Mongolia | 0.0% · 0 TWh |
| Montenegro | 0.0% · 0 TWh |
| Namibia | 0.0% · 0 TWh |
| Nepal | 0.0% · 0 TWh |
| New Caledonia | 0.0% · 0 TWh |
| Nicaragua | 0.0% · 0 TWh |
| North Korea | 0.0% · 0 TWh |
| Paraguay | 0.0% · 0 TWh |
| South Africa | 0.0% · 0 TWh |
| Sudan | 0.0% · 0 TWh |
| Uganda | 0.0% · 0 TWh |
| Uruguay | 0.0% · 0 TWh |
| Zambia | 0.0% · 0 TWh |
| Zimbabwe | 0.0% · 0 TWh |
The countries most dependent on natural gas for electricity
Measured as a share, the ranking changes completely. Among countries generating at least 10 TWh a year, Turkmenistan produces 99.97% of its electricity from gas, Bahrain 99.7% and Algeria 98.6%. The list continues with Qatar (96%), Tunisia (94.5%), Singapore (92.2%) and Oman (91.2%). Almost all are gas producers or, like Singapore, have no rivers, wind or room for large solar farms.
At the other end, several large systems barely use gas for power: China (3.2%), Brazil (6.4%), which relies on its dams, and India, which depends on coal. Dependence matters because the price of gas, especially liquefied natural gas (LNG) shipped by sea, has swung sharply since 2021 and dragged up power tariffs in importing countries. The effect on the region's bills is in our ranking of electricity prices in Latin America.
| 1 | United States | 1,869.9 | 42.6% | 1,807.3 |
| 2 | Russia | 553.5 | 45.8% | 545.0 |
| 3 | Japan | 347.0 | 34.2% | 336.3 |
| 4 | People's Republic of China | 320.7 | 3.2% | 337.6 |
| 5 | Iran | 286.0 | 72.3% | 292.2 |
| 6 | Saudi Arabia | 282.1 | 61.5% | 300.4 |
| 7 | Mexico | 275.5 | 71.0% | 272.9 |
| 8 | Egypt | 185.1 | 78.1% | 184.4 |
| 9 | South Korea | 180.4 | 28.7% | 176.0 |
| 10 | Thailand | 136.4 | 62.8% | 123.3 |
| 11 | Taiwan | 125.0 | 43.2% | 141.0 |
| 12 | United Arab Emirates | 124.3 | 69.3% | 125.5 |
| 13 | Canada | 121.3 | 18.9% | 130.1 |
| 14 | Italy | 118.6 | 44.3% | 125.6 |
| 15 | Algeria | 95.0 | 98.6% | No data |
| 16 | United Kingdom | 86.3 | 30.3% | 92.0 |
| 17 | Argentina | 82.9 | 54.1% | 85.9 |
| 18 | Iraq | 79.3 | 53.0% | No data |
| 19 | Germany | 78.4 | 15.9% | 83.5 |
| 20 | Malaysia | 75.2 | 35.6% | 70.4 |
| 21 | Indonesia | 71.7 | 14.1% | 61.3 |
| 22 | Bangladesh | 67.0 | 65.9% | 66.5 |
| 23 | Turkey | 63.3 | 18.5% | 78.4 |
| 24 | Uzbekistan | 61.3 | 75.2% | 62.7 |
| 25 | Kuwait | 57.4 | 62.1% | 55.8 |
| 26 | Israel | 57.4 | 71.4% | 65.4 |
| 27 | India | 56.4 | 2.8% | 48.5 |
| 28 | Singapore | 54.9 | 92.2% | 54.8 |
| 29 | Qatar | 54.4 | 96.0% | No data |
| 30 | Spain | 52.3 | 18.6% | 62.1 |
| 31 | Australia | 48.8 | 17.2% | 44.2 |
| 32 | Brazil | 47.8 | 6.4% | 59.4 |
| 33 | Oman | 44.8 | 91.2% | 48.5 |
| 34 | Netherlands | 44.3 | 36.2% | 47.1 |
| 35 | Pakistan | 42.3 | 28.0% | 39.3 |
| 36 | Bahrain | 37.9 | 99.7% | No data |
| 37 | Turkmenistan | 33.0 | 100.0% | No data |
| 38 | Kazakhstan | 31.1 | 26.2% | 33.7 |
| 39 | Nigeria | 28.2 | 75.0% | 28.9 |
| 40 | Belarus | 27.0 | 58.9% | 25.5 |
| 41 | Libya | 25.8 | 74.5% | No data |
| 42 | Azerbaijan | 24.5 | 88.0% | 24.6 |
| 43 | Hong Kong | 24.0 | 64.1% | No data |
| 44 | Peru | 23.2 | 39.2% | 21.8 |
| 45 | Vietnam | 21.8 | 7.0% | 19.7 |
| 46 | Greece | 21.5 | 37.7% | 23.3 |
| 47 | Poland | 20.5 | 11.9% | 24.8 |
| 48 | Tunisia | 20.2 | 94.5% | 21.2 |
| 49 | Colombia | 18.6 | 20.8% | 11.9 |
| 50 | France | 18.1 | 3.2% | 17.2 |
| 51 | Philippines | 18.1 | 14.5% | 21.3 |
| 52 | Ireland | 15.1 | 48.6% | 15.0 |
| 53 | Ghana | 14.9 | 61.4% | No data |
| 54 | Jordan | 14.7 | 62.0% | No data |
| 55 | Belgium | 14.2 | 18.7% | 15.0 |
| 56 | Syria | 13.0 | 52.3% | No data |
| 57 | Chile | 12.7 | 14.3% | 13.5 |
| 58 | Myanmar | 10.0 | 46.1% | No data |
| 59 | Trinidad and Tobago | 9.5 | 99.5% | No data |
| 60 | Romania | 9.2 | 17.4% | 8.5 |
| 61 | Bolivia | 8.7 | 64.5% | 8.5 |
| 62 | Côte d'Ivoire | 7.7 | 70.9% | No data |
| 63 | Austria | 7.5 | 9.6% | 8.7 |
| 64 | Hungary | 7.1 | 18.8% | 8.2 |
| 65 | Dominican Republic | 7.0 | 29.1% | 6.1 |
| 66 | Portugal | 5.6 | 11.9% | 8.4 |
| 67 | Tanzania | 5.6 | 62.8% | No data |
| 68 | Puerto Rico | 5.4 | 27.0% | 5.8 |
| 69 | Moldova | 5.2 | 85.7% | 1.9 |
| 70 | Brunei Darussalam | 4.4 | 79.1% | No data |
| 71 | Morocco | 4.3 | 10.2% | 4.8 |
| 72 | New Zealand | 4.3 | 9.8% | 3.8 |
| 73 | Republic of the Congo | 4.0 | 73.8% | No data |
| 74 | Czechia | 3.8 | 5.2% | 4.1 |
| 75 | Venezuela | 3.6 | 4.5% | No data |
| 76 | Armenia | 3.5 | 39.0% | 3.4 |
| 77 | Croatia | 3.3 | 21.3% | 2.7 |
| 78 | Mozambique | 3.1 | 15.8% | No data |
| 79 | Slovakia | 2.9 | 9.8% | 3.3 |
| 80 | Georgia | 2.8 | 20.2% | 2.8 |
| 81 | Jamaica | 2.8 | 56.9% | No data |
| 82 | Panama | 2.8 | 20.8% | No data |
| 83 | Cuba | 2.7 | 13.6% | No data |
| 84 | Bulgaria | 2.0 | 5.3% | 1.9 |
| 85 | Malta | 1.8 | 84.0% | 1.8 |
| 86 | Serbia | 1.7 | 4.7% | 2.2 |
| 87 | Latvia | 1.7 | 26.5% | 1.7 |
| 88 | Cameroon | 1.6 | 22.0% | No data |
| 89 | Norway | 1.5 | 0.9% | 0.9 |
| 90 | Angola | 1.4 | 9.0% | No data |
| 91 | North Macedonia | 1.3 | 20.5% | 1.2 |
| 92 | Gabon | 1.2 | 44.2% | No data |
| 93 | Equatorial Guinea | 1.1 | 72.5% | No data |
How gas-fired electricity has changed since 2000
In 2000, the world generated 2,747 TWh from natural gas, 17.9% of its electricity. In 2024 it was 6,893 TWh: generation grew 2.5-fold in 25 years. Gas's share rose to a peak of 23.9% in 2020 and has fallen every year since, because new demand is increasingly met with solar and wind.
View the data as a table
| World | |
|---|---|
| 2000 | 2,747 |
| 2001 | 2,916 |
| 2002 | 3,106 |
| 2003 | 3,257 |
| 2004 | 3,505 |
| 2005 | 3,682 |
| 2006 | 3,902 |
| 2007 | 4,221 |
| 2008 | 4,363 |
| 2009 | 4,384 |
| 2010 | 4,826 |
| 2011 | 4,880 |
| 2012 | 5,176 |
| 2013 | 5,074 |
| 2014 | 5,229 |
| 2015 | 5,553 |
| 2016 | 5,857 |
| 2017 | 5,982 |
| 2018 | 6,221 |
| 2019 | 6,403 |
| 2020 | 6,396 |
| 2021 | 6,570 |
| 2022 | 6,605 |
| 2023 | 6,712 |
| 2024 | 6,893 |
| 2025 | 6,922 |
The country race shows two big shifts. The United States always led, but widened the gap: from 615 TWh to 1,870 TWh. China started almost from zero (5.8 TWh in 2000) and reached 320.7 TWh, fourth place. Saudi Arabia and Iran also rose sharply by replacing oil with gas in their plants, and Japan has fallen from its 2017 peak (464 TWh), reached when gas was covering much of the electricity lost when its nuclear reactors were shut after Fukushima.
View the data as a table
| 2000 | 2001 | 2002 | 2003 | 2004 | 2005 | 2006 | 2007 | 2008 | 2009 | 2010 | 2011 | 2012 | 2013 | 2014 | 2015 | 2016 | 2017 | 2018 | 2019 | 2020 | 2021 | 2022 | 2023 | 2024 | |
|---|---|---|---|---|---|---|---|---|---|---|---|---|---|---|---|---|---|---|---|---|---|---|---|---|---|
| United States | 615 | 639 | 691 | 650 | 710 | 761 | 816 | 897 | 883 | 921 | 988 | 1,014 | 1,226 | 1,125 | 1,127 | 1,334 | 1,378 | 1,296 | 1,469 | 1,586 | 1,624 | 1,579 | 1,687 | 1,806 | 1,870 |
| Russia | 370 | 377 | 385 | 407 | 423 | 440 | 455 | 489 | 494 | 470 | 521 | 521 | 526 | 530 | 535 | 530 | 522 | 516 | 524 | 512 | 466 | 513 | 511 | 522 | 554 |
| Japan | 259 | 257 | 253 | 273 | 258 | 253 | 280 | 297 | 325 | 325 | 326 | 380 | 436 | 424 | 451 | 418 | 458 | 464 | 446 | 417 | 409 | 386 | 379 | 347 | 347 |
| People's Republic of China | 6 | 5 | 4 | 5 | 8 | 12 | 24 | 34 | 35 | 57 | 78 | 109 | 110 | 116 | 133 | 167 | 188 | 203 | 216 | 233 | 253 | 287 | 276 | 298 | 321 |
| Iran | 82 | 90 | 98 | 110 | 115 | 125 | 125 | 139 | 135 | 149 | 174 | 142 | 156 | 138 | 192 | 207 | 225 | 253 | 266 | 224 | 248 | 282 | 279 | 294 | 286 |
| Saudi Arabia | 64 | 77 | 87 | 91 | 99 | 108 | 105 | 103 | 101 | 94 | 111 | 116 | 132 | 139 | 153 | 165 | 189 | 223 | 227 | 224 | 232 | 242 | 248 | 270 | 282 |
| Mexico | 40 | 51 | 70 | 81 | 92 | 87 | 116 | 129 | 131 | 138 | 164 | 166 | 168 | 179 | 187 | 198 | 199 | 205 | 211 | 228 | 242 | 229 | 232 | 256 | 276 |
| Egypt | 42 | 49 | 58 | 64 | 74 | 77 | 83 | 89 | 95 | 99 | 110 | 118 | 127 | 123 | 125 | 130 | 139 | 152 | 167 | 172 | 167 | 179 | 183 | 179 | 185 |
| South Korea | 30 | 34 | 43 | 46 | 63 | 65 | 75 | 84 | 82 | 71 | 104 | 115 | 129 | 144 | 131 | 122 | 131 | 135 | 163 | 155 | 163 | 180 | 175 | 172 | 180 |
| Thailand | 61 | 71 | 79 | 86 | 90 | 95 | 94 | 98 | 105 | 106 | 118 | 108 | 119 | 119 | 120 | 129 | 126 | 121 | 116 | 122 | 114 | 113 | 115 | 129 | 136 |
| United Kingdom | 148 | 142 | 152 | 149 | 157 | 153 | 141 | 166 | 176 | 167 | 176 | 147 | 100 | 96 | 101 | 100 | 143 | 137 | 132 | 133 | 112 | 123 | 125 | 102 | 86 |
| Germany | 49 | 56 | 56 | 63 | 63 | 72 | 75 | 78 | 89 | 80 | 89 | 86 | 76 | 67 | 61 | 62 | 81 | 86 | 82 | 90 | 95 | 90 | 79 | 77 | 78 |
Does your company work in natural gas, LNG, transmission or energy storage? Reach Energía Futura's readers.
See advertising optionsNatural gas electricity in Latin America
Mexico is the Latin American country that generates the most electricity from natural gas and the seventh in the world: 275.5 TWh in 2024, 71% of its electricity, much of it with gas piped from the United States. It is followed by Argentina (82.9 TWh and 54.1%), which uses gas from Vaca Muerta, and Brazil (47.8 TWh, but only 6.4% of its mix). Peru generates 39.2% of its electricity with gas from Camisea, and Bolivia 64.5%.
| Country | Gas-fired generation 2024 (TWh) | % of its electricity | World rank |
|---|---|---|---|
| Mexico | 275.5 | 71.0% | 7 |
| Argentina | 82.9 | 54.1% | 17 |
| Brazil | 47.8 | 6.4% | 32 |
| Peru | 23.2 | 39.2% | 44 |
| Colombia | 18.6 | 20.8% | 49 |
| Chile | 12.7 | 14.3% | 57 |
| Trinidad and Tobago | 9.5 | 99.5% | 59 |
| Bolivia | 8.7 | 64.5% | 61 |
| Dominican Republic | 7.0 | 29.1% | 65 |
Source: Ember (2026), Yearly Electricity Data. Costa Rica, Paraguay and Uruguay generate practically no electricity from gas.
Chile's place in natural gas electricity
Chile generated 12.7 TWh from natural gas in 2024, 14.3% of its electricity, and ranked 57th in the world. The preliminary 2025 figure rises to 13.5 TWh and 15.3%. According to the National Energy Commission, the National Electricity System had 3,888 MW of natural gas plants in operation in July 2026, 11.2% less than a year earlier, according to the Generadoras de Chile September 2026 bulletin.
View the data as a table
| Chile | World | |
|---|---|---|
| 2000 | 25.4% | 17.9% |
| 2001 | 31.5% | 18.8% |
| 2002 | 29.7% | 19.3% |
| 2003 | 35.6% | 19.5% |
| 2004 | 32.6% | 20.1% |
| 2005 | 26.0% | 20.3% |
| 2006 | 20.8% | 20.7% |
| 2007 | 7.9% | 21.4% |
| 2008 | 3.7% | 21.6% |
| 2009 | 6.5% | 21.9% |
| 2010 | 17.7% | 22.6% |
| 2011 | 20.9% | 22.1% |
| 2012 | 18.5% | 22.9% |
| 2013 | 15.3% | 21.8% |
| 2014 | 14.6% | 22.0% |
| 2015 | 15.2% | 23.1% |
| 2016 | 15.0% | 23.7% |
| 2017 | 16.9% | 23.5% |
| 2018 | 16.0% | 23.5% |
| 2019 | 18.9% | 23.8% |
| 2020 | 18.3% | 23.9% |
| 2021 | 18.0% | 23.2% |
| 2022 | 17.7% | 22.8% |
| 2023 | 18.8% | 22.5% |
| 2024 | 14.3% | 22.2% |
| 2025 | 15.3% | 21.7% |
Chile's series is the bumpiest in the region. In 2003 gas generated 35.6% of its electricity, almost all of it piped in from Argentina. When that supply was cut, the share collapsed to 3.7% in 2008 and the country turned to diesel and coal. The recovery came with the liquefied natural gas terminals at Quintero and Mejillones, and since 2010 gas has ranged between 14% and 21% of generation.
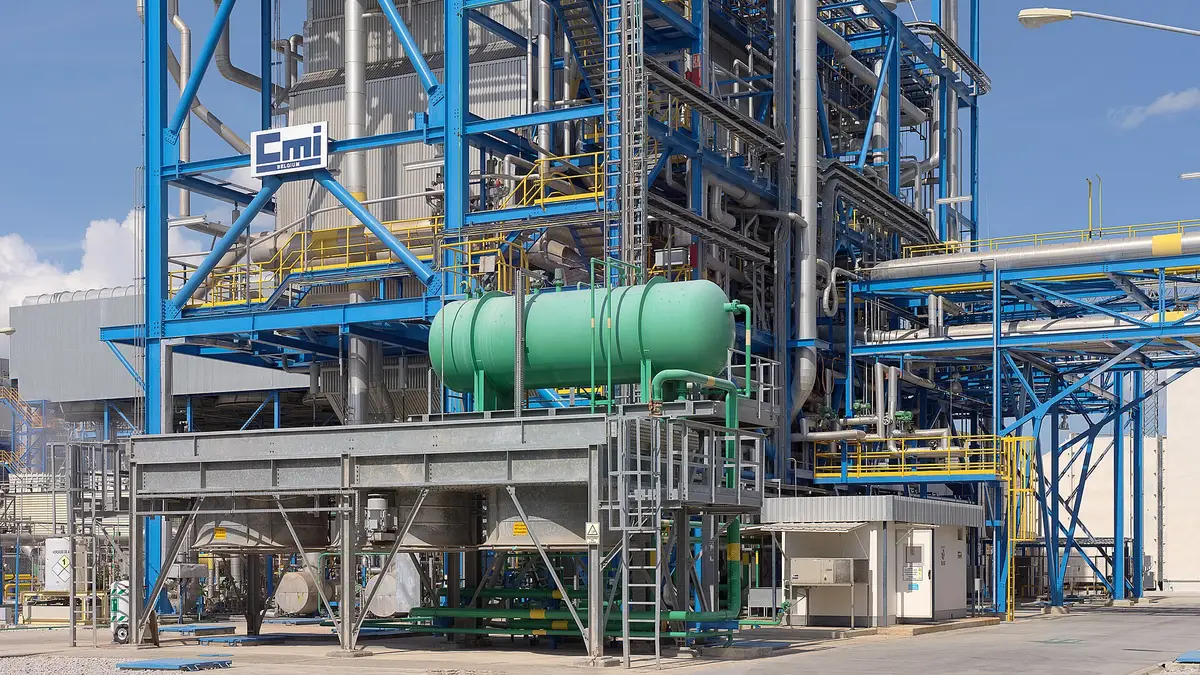
Gas is also part of the coal exit: several coal plants are being converted to gas instead of closing. The first was Engie's in Mejillones, as we reported in Chile's first coal-to-gas conversion. In daily operation, gas plants are the ones that ramp up and down to follow solar at sunset, along with batteries.
What's next for gas-fired generation
The preliminary 2025 data send mixed signals. The United States fell to 1,807 TWh (−3.3%) because of higher gas prices and solar growth, while China (+5.3%), Saudi Arabia (+6.5%) and Taiwan (+12.8%) kept rising. Worldwide, gas generation barely grew and its share fell for the fifth year in a row.
Natural gas emits roughly half the CO₂ of coal per kWh in a modern plant, which is why many countries use it as a transition fuel. But it is still fossil: how much CO₂ each country's electricity emits is in our ranking of the cleanest and dirtiest electricity.
Methodology
The data come from Ember, which compiles official electricity generation statistics by country (national agencies, Eurostat, the US EIA and the IEA, among others), in its annual dataset downloaded on 15 November 2026. The ranking uses 2024, the latest year with data for every country; 2025 is preliminary and only covers 94 countries. The gas category includes pipeline natural gas and LNG. Chile's capacity in MW comes from the CNE, via Generadoras de Chile, and may differ from Ember's estimate.
How to cite this data
Energía Futura (2026). "Countries that generate the most electricity from natural gas 2026: world ranking and Chile's place". Updated on 15 November 2026. energiafutura.cl/en/news/countries-that-generate-the-most-electricity-from-natural-gas-2026-world-ranking-and-chile. Data: Ember (2026), Yearly Electricity Data.
Frequently asked questions
Which country generates the most electricity from natural gas?
The United States, with 1,870 TWh in 2024, 27.1% of the world total and 42.6% of its own electricity, according to Ember.
How much electricity is generated from natural gas worldwide?
6,893 TWh in 2024, 22.2% of world electricity. The preliminary 2025 figure is 6,922 TWh, with a 21.7% share.
Which country depends most on gas for its electricity?
Turkmenistan, which generates 99.97% of its electricity from gas, followed by Bahrain (99.7%) and Algeria (98.6%), among countries generating at least 10 TWh a year.
Where does Chile rank?
57th, with 12.7 TWh in 2024, 14.3% of its electricity. In 2025 it rose to 13.5 TWh (15.3%).
Which Latin American country generates the most electricity from gas?
Mexico, with 275.5 TWh in 2024 (71% of its electricity), seventh in the world. It is followed by Argentina and Brazil.