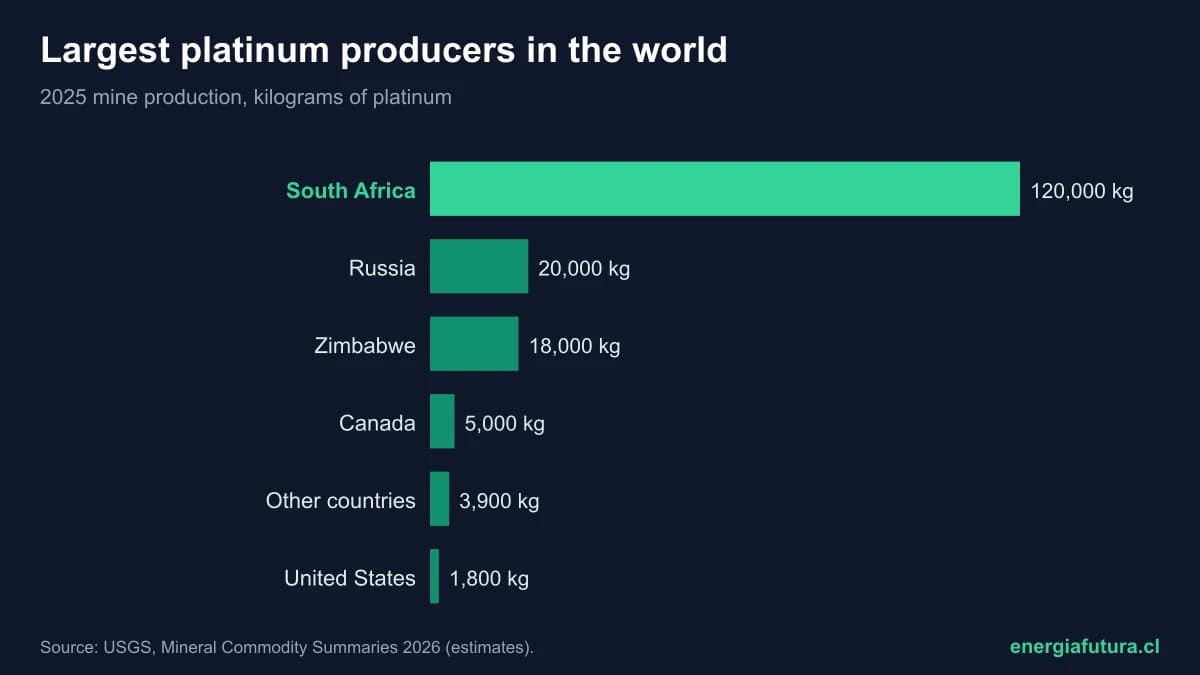
Updated on 6 November 2026. South Africa is the world's largest platinum producer: in 2025 it produced about 120,000 kilograms, 71% of the world total of 170,000 kilograms, according to the US Geological Survey (USGS) platinum-group metals summary, Mineral Commodity Summaries 2026, published in February. Russia is second, with 20,000 kilograms, and Zimbabwe third, with 18,000. In palladium, the other major metal of the group, first place goes to Russia, with 84,000 kilograms.
Platinum and palladium are mainly used in car catalytic converters, which reduce engine emissions. But platinum is also key for hydrogen: it is found in PEM membrane electrolysers and in fuel cells. This data sheet gathers the platinum and palladium production ranking, the trend since 2020, reserves, prices and its role in the energy transition.
View the data as a table
| World platinum production 2025 | 170,000 kg |
| South Africa's share | 70.6% |
| South Africa's reserves (platinum group) | 82.9% |
| Average platinum price 2025 | US$1,200/oz |
Ranking of the largest platinum producers in the world in 2025
The table ranks countries by 2025 platinum mine production, in kilograms. The USGS reports Canada, the United States and a group of "other countries" separately; the 2025 figures are estimates, and Russia's is also estimated for 2024.
| Rank | Country | 2024 production (kg) | 2025e production (kg) | Share of 2025 total |
|---|---|---|---|---|
| 1 | South Africa | 126,000 | 120,000 | 70.6% |
| 2 | Russia | 22,000 (est.) | 20,000 | 11.8% |
| 3 | Zimbabwe | 18,400 | 18,000 | 10.6% |
| 4 | Canada | 5,700 | 5,000 | 2.9% |
| 5 | United States | 3,010 | 1,800 | 1.1% |
| Other countries | 3,860 | 3,900 | 2.3% | |
| World total (rounded) | 179,000 | 170,000 | 100% |
Source: USGS, Mineral Commodity Summaries 2026. Percentages calculated by Energía Futura. South Africa's platinum-group metal production fell by about 9% in 2025 because of lower palladium prices, the costs of deep-level mining and disruptions to the electricity supply; Russia's fell by about 6%, according to the USGS.
View the data as a table
| kg | |
|---|---|
| South Africa | 120,000 kg |
| Russia | 20,000 kg |
| Zimbabwe | 18,000 kg |
| Canada | 5,000 kg |
| United States | 1,800 kg |
Platinum and palladium: who produces each metal
Both metals come from the same mines, but in different proportions depending on the geology. In South Africa, the Bushveld Complex holds more platinum than palladium; in Russia, the nickel and copper mines of Norilsk are rich in palladium. That is why Russia leads in palladium with 84,000 kilograms and South Africa in platinum. Canada and the United States produce more palladium than platinum.
| Country | Platinum 2025e (kg) | Palladium 2025e (kg) | Palladium as share of country total |
|---|---|---|---|
| South Africa | 120,000 | 70,000 | 37% |
| Russia | 20,000 | 84,000 | 81% |
| Zimbabwe | 18,000 | 15,000 | 45% |
| Canada | 5,000 | 16,000 | 76% |
| United States | 1,800 | 6,200 | 78% |
| Other countries | 3,900 | 2,900 | 43% |
| World total | 170,000 | 190,000 | 53% |
Source: USGS, Mineral Commodity Summaries 2026. Last column calculated by Energía Futura from each country's combined platinum and palladium.
View the data as a table
| Platinum | Palladium | |
|---|---|---|
| South Africa | 120,000 kg | 70,000 kg |
| Russia | 20,000 kg | 84,000 kg |
| Zimbabwe | 18,000 kg | 15,000 kg |
| Canada | 5,000 kg | 16,000 kg |
| United States | 1,800 kg | 6,200 kg |
The two metals compete in catalytic converters. Because palladium was cheaper than platinum for years, it replaced platinum in most gasoline-engine converters; in diesel ones, according to the USGS, about 25% of the platinum can routinely be substituted with palladium, and up to 50% in some applications. With palladium cheaper than platinum again since 2024, manufacturers are adjusting that mix once more.
The series shows that South Africa's platinum output had its best recent year in 2021, with 142,000 kilograms, and has since moved between 120,000 and 126,000. Zimbabwe rose from 15,000 kilograms in 2020 to 18,000 in 2025, while the United States fell from 4,200 to 1,800, because one of its Montana operations was placed on care and maintenance.
| Year | South Africa | Russia | Zimbabwe | Canada | United States | World total |
|---|---|---|---|---|---|---|
| 2020 | 112,000 | 23,000 | 15,000 | 7,000 | 4,200 | 166,000 |
| 2021 | 142,000 | 21,000 | 14,700 | 6,000 | 4,020 | 192,000 |
| 2022 | 124,000 | 20,000 | 17,000 | 5,400 | 3,000 | 174,000 |
| 2023 | 125,000 | 21,000 | 19,200 | 5,170 | 3,040 | 179,000 |
| 2024 | 126,000 | 22,000 | 18,400 | 5,700 | 3,010 | 179,000 |
| 2025e | 120,000 | 20,000 | 18,000 | 5,000 | 1,800 | 170,000 |
Source: USGS, Mineral Commodity Summaries, 2022 to 2026 editions, in kilograms of platinum. Each year uses the latest figure published; Russia's are estimates.
View the data as a table
| South Africa | Russia | Zimbabwe | Canada | United States | |
|---|---|---|---|---|---|
| 2020 | 112.0 | 23.0 | 15.0 | 7.0 | 4.2 |
| 2021 | 142.0 | 21.0 | 14.7 | 6.0 | 4.0 |
| 2022 | 124.0 | 20.0 | 17.0 | 5.4 | 3.0 |
| 2023 | 125.0 | 21.0 | 19.2 | 5.2 | 3.0 |
| 2024 | 126.0 | 22.0 | 18.4 | 5.7 | 3.0 |
| 2025 | 120.0 | 20.0 | 18.0 | 5.0 | 1.8 |
View the data as a table
| 2020 | 2021 | 2022 | 2023 | 2024 | 2025 | |
|---|---|---|---|---|---|---|
| South Africa | 112,000 | 142,000 | 124,000 | 125,000 | 126,000 | 120,000 |
| Russia | 23,000 | 21,000 | 20,000 | 21,000 | 22,000 | 20,000 |
| Zimbabwe | 15,000 | 14,700 | 17,000 | 19,200 | 18,400 | 18,000 |
| Canada | 7,000 | 6,000 | 5,400 | 5,170 | 5,700 | 5,000 |
| United States | 4,200 | 4,020 | 3,000 | 3,040 | 3,010 | 1,800 |
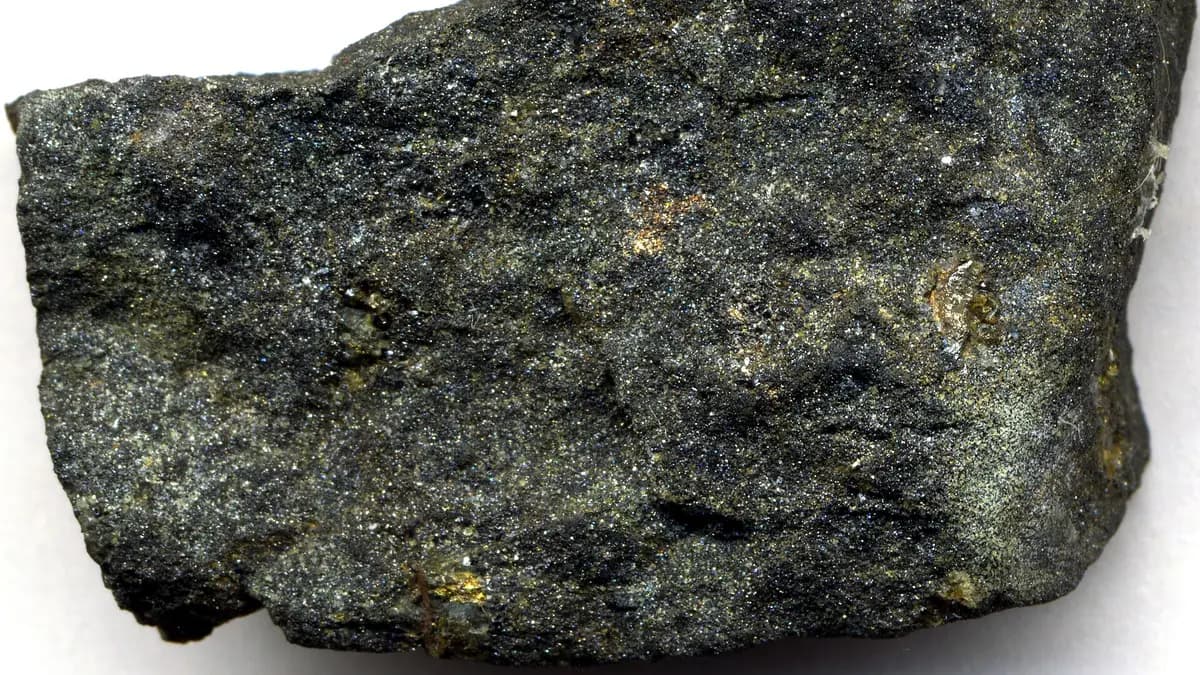
Platinum and palladium reserves by country
The USGS estimates world platinum-group metal reserves at more than 76 million kilograms (76,000 tonnes) and resources at more than 100 million kilograms. South Africa holds 63 million kilograms, about 83% of known reserves, almost all in the Bushveld Complex.
| Country | Platinum-group metal reserves (kg) | Share of total |
|---|---|---|
| South Africa | 63,000,000 | 82.9% |
| Russia | 11,000,000 | 14.5% |
| Zimbabwe | 1,300,000 | 1.7% |
| United States | 590,000 | 0.8% |
| Canada | 310,000 | 0.4% |
| World total | Over 76,000,000 | 100% |
Source: USGS, Mineral Commodity Summaries 2026. Russia's reserves follow the Russian classification excluding category C2. Percentages calculated by Energía Futura on 76 million kilograms.
Platinum and palladium prices
The average price of platinum rose to about US$1,200 per troy ounce in 2025, 25% more than in 2024, and palladium to US$1,100 (+11%), according to the USGS with S&P Global Platts data. Palladium had reached US$2,419 in 2021, when it was worth more than twice as much as platinum. Iridium, another group metal used in electrolysers, fell 9%, which the USGS partly attributes to waning investor enthusiasm for hydrogen.
| Year | Platinum (US$/oz) | Palladium (US$/oz) |
|---|---|---|
| 2020 | 886 | 2,205 |
| 2021 | 1,094 | 2,419 |
| 2022 | 967 | 2,134 |
| 2023 | 973 | 1,352 |
| 2024 | 961 | 995 |
| 2025e | 1,200 | 1,100 |
View the data as a table
| Platinum | Palladium | |
|---|---|---|
| 2020 | US$886 | US$2,205 |
| 2021 | US$1,094 | US$2,419 |
| 2022 | US$967 | US$2,134 |
| 2023 | US$973 | US$1,352 |
| 2024 | US$961 | US$995 |
| 2025 | US$1,200 | US$1,100 |
Source: USGS, Mineral Commodity Summaries 2026 (Engelhard annual average prices). The market has been tight for years: the World Platinum Investment Council estimates a deficit of more than 1.4 million ounces in 2025 and forecasts a surplus of 265,000 ounces in 2026, due to investment outflows, according to its second-quarter Platinum Quarterly, published on 9 September 2026.
Does your company work in mining, hydrogen or critical metals? Reach Energía Futura's readers.
See advertising formatsPlatinum and hydrogen: its role in the energy transition
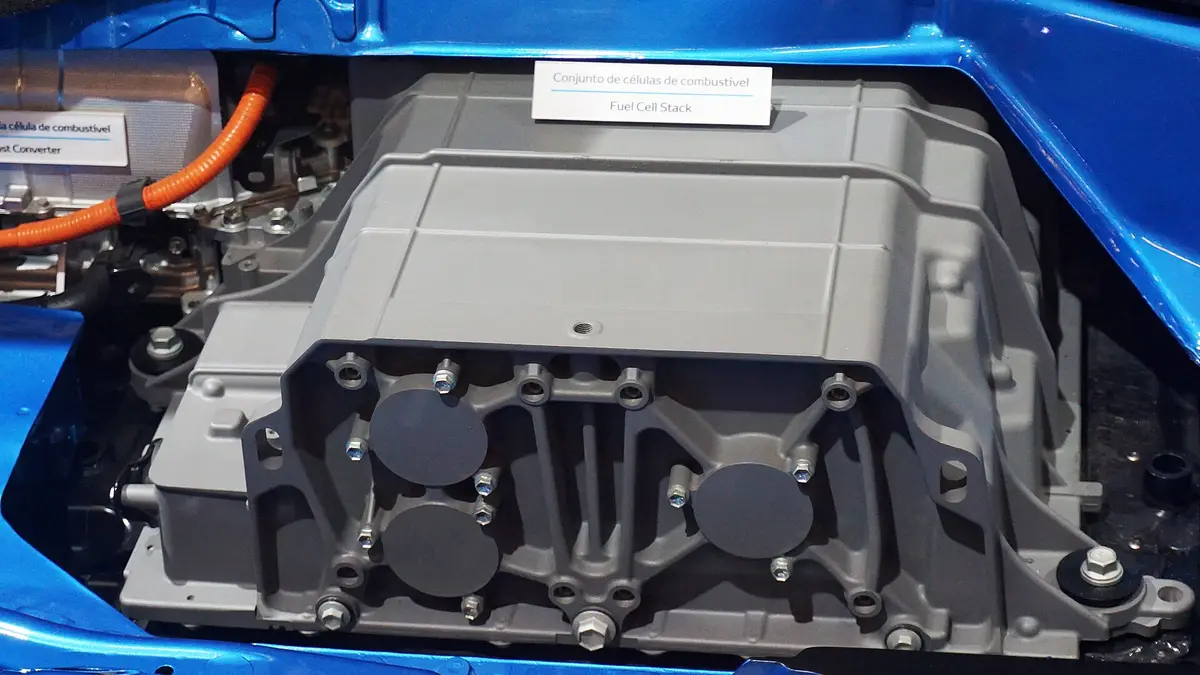
In a PEM electrolyser, which splits water into hydrogen and oxygen using electricity, platinum acts as the catalyst at the cathode and iridium at the anode. In a fuel cell, the reverse process, platinum is again the catalyst that combines hydrogen and oxygen to produce electricity. The World Platinum Investment Council expects platinum demand for hydrogen to rise 8% in 2026, to 77,000 ounces, driven by electrolysers under construction and fuel cells for backup power.
Outside hydrogen, the USGS lists the platinum group's uses as car catalytic converters, the main one; catalysts for chemicals and oil refining; medical and dental devices; electronics such as hard disks and capacitors; glass manufacturing; jewellery and investment. The WPIC highlights that in 2026 platinum demand for glass will grow 23% and electrical demand 19%, driven by data centres and artificial intelligence, while demand from the oil industry falls 28%.
Hydrogen is still a small share: about 1% of total platinum demand of 7.1 million ounces forecast for 2026, against 2.9 million for car catalysts. The WPIC warns that the pace is uneven, with delayed projects and uncertain investment decisions. The world's largest electrolysers, which we reviewed in the largest green hydrogen plant in the world, use both PEM technology and alkaline technology, which does not need platinum.
Chile does not produce platinum, but it is part of the same debate on critical minerals for hydrogen and batteries, alongside the vanadium in flow batteries we analysed in the largest vanadium producers and the manganese in the largest manganese producers. Recycling is another important source: in 2025 about 140,000 kilograms of platinum and palladium were recovered from scrap worldwide, according to the USGS.
Supply is the other side of the story. More than two thirds of the world's platinum comes from South Africa, where deep underground mines face rising costs and disruptions to the electricity supply, according to the USGS, and Russia, the second producer, operates under the uncertainty created by the war in Ukraine. Any disruption in either country moves prices worldwide. That concentration explains why platinum is watched closely by countries planning hydrogen industries, and why recycling, which already recovers about 140,000 kilograms of platinum and palladium a year, is gaining weight.
How to cite this data
Energía Futura (2026). "Largest platinum producers in the world 2026: country ranking, reserves and role in hydrogen". Updated on 6 November 2026. energiafutura.cl/en/news/largest-platinum-producers-in-the-world-2026-country-ranking-reserves-and-role-in-hydrogen. Data: USGS, Mineral Commodity Summaries 2022-2026; World Platinum Investment Council, Platinum Quarterly Q2 2026.
Frequently asked questions
Which country is the largest platinum producer?
South Africa, with about 120,000 kilograms in 2025, 71% of the world total, according to the USGS.
How much platinum is produced in the world?
About 170,000 kilograms (170 tonnes) in 2025, against 179,000 in 2024. For palladium, about 190,000 kilograms.
Which country produces the most palladium?
Russia, with about 84,000 kilograms in 2025, followed by South Africa (70,000).
What is platinum used for in hydrogen?
As a catalyst in PEM electrolysers, which produce hydrogen, and in fuel cells, which turn it into electricity.
Which country has the largest platinum reserves?
South Africa, with 63 million kilograms of platinum-group metals, about 83% of the world total.