Power generation in Latin America and the Caribbean reached 169 TWh in July 2026, 3.7% more than the 163 TWh of July 2025 and the highest monthly figure in the past 12 months, according to the monthly electricity generation report of the Latin American and Caribbean Energy Organization (Olacde), published in late October with data from its Energy Information System (sieLAC).
Renewable sources supplied 61.7% of that electricity, slightly above June's 61.5%. Of Olacde's 27 member countries, nine were above the regional average: Paraguay (100%) tops the list and Chile (65.3%) closes it.
169 TWh
Total generation
+3.7% vs. July 2025
61.7%
Renewable share
June 2026: 61.5%
65.3%
Renewables in Chile
Ninth of nine countries above average
Source: Olacde, monthly electricity generation report for LAC, July 2026
View the data as a table
| Total generation | 169 TWh · +3.7% vs. July 2025 |
| Renewable share | 61.7% · June 2026: 61.5% |
| Renewables in Chile | 65.3% · Ninth of nine countries above average |
Latin America power generation in July 2026, by source
Hydropower remains the backbone of the regional system: it supplied 75.9 TWh, or 44.9% of the total. It is followed by natural gas, with 43.8 TWh (25.9%), and wind power, with 17.7 TWh (10.5%). Solar came in at 8.3 TWh (4.9%), behind oil and oil products.
| Source | Generation in July 2026 (TWh) | Share |
|---|---|---|
| Hydropower | 75.9 | 44.9% |
| Natural gas | 43.8 | 25.9% |
| Wind | 17.7 | 10.5% |
| Oil and oil products | 10.5 | 6.2% |
| Solar | 8.3 | 4.9% |
| Coal | 6.1 | 3.6% |
| Nuclear | 4.3 | 2.6% |
| Bioenergy | 1.6 | 1.0% |
| Geothermal | 0.8 | 0.5% |
| Total | 169 | 100% |
Source: Olacde, with sieLAC data, July 2026 report published in October.
Olacde describes a mix dominated by renewables that nonetheless "requires flexible generation to offset the variability of clean sources". In practice, that backup comes mostly from natural gas, which generates more than four times as much as oil and seven times as much as coal.
Which sources grew and which fell compared with 2025
Compared with July 2025, almost every source generated more. The largest increase came from natural gas, with an extra 2.9 TWh, followed by solar (+1.9 TWh), oil (+1.8 TWh) and hydropower (+1.6 TWh). Only wind (-0.2 TWh) and bioenergy (-4.1 TWh) declined. The net result was a rise of 6 TWh, which Olacde attributes to higher electricity demand.
| Source | Change, July 2026 vs. July 2025 |
|---|---|
| Natural gas | +2.9 TWh |
| Solar | +1.9 TWh |
| Oil and oil products | +1.8 TWh |
| Hydropower | +1.6 TWh |
| Coal | +1.4 TWh |
| Nuclear | +0.7 TWh |
| Geothermal | +0.1 TWh |
| Wind | -0.2 TWh |
| Bioenergy | -4.1 TWh |
| Total | +6 TWh |
Source: Olacde, July 2026.
One detail deserves a careful read: several press reports said wind power "grew 14%" in July. That figure is the month-on-month change, that is, compared with June 2026, not the comparison with a year earlier, in which wind fell slightly. In the same monthly comparison, solar dropped 32%, as expected in the middle of the southern hemisphere winter, when days are shorter in Brazil, Chile and the rest of the Southern Cone.
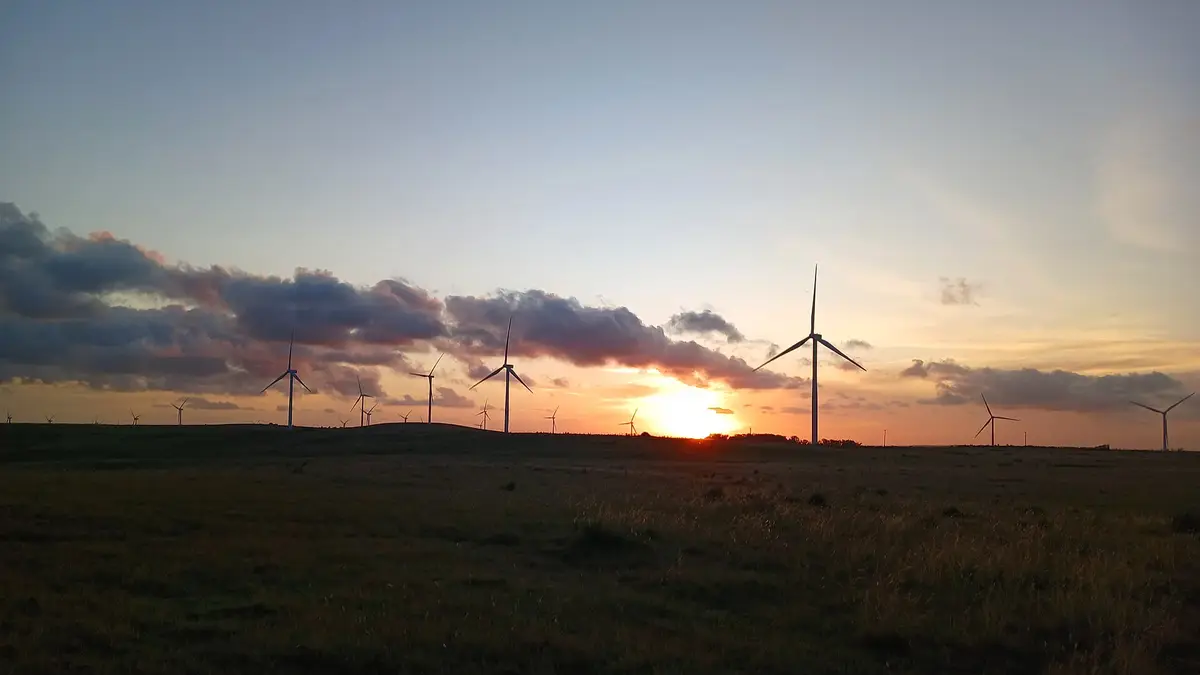
The countries with the most renewables in Latin America power generation
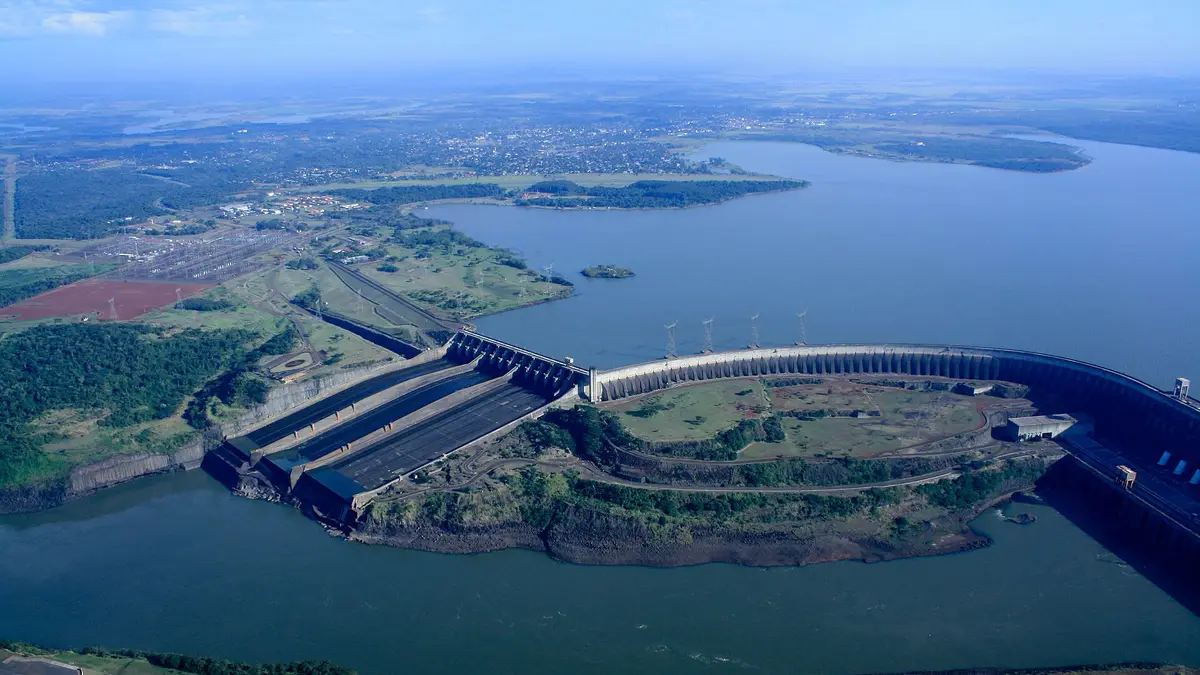
Paraguay generated 100% of its electricity from renewable sources in July, thanks to the binational Itaipu and Yacyretá dams. It is followed by Uruguay (98.3%), Costa Rica (98%) and Brazil (90%). Chile, at 65.3%, is the last of the nine countries that exceeded the regional average of 61.7%.
| Rank | Country | Renewables in generation (July 2026) |
|---|---|---|
| 1 | Paraguay | 100% |
| 2 | Uruguay | 98.3% |
| 3 | Costa Rica | 98% |
| 4 | Brazil | 90% |
| 5 | Ecuador | 89.7% |
| 6 | Venezuela | 83.5% |
| 7 | Colombia | 75.4% |
| 8 | Belize | 74.9% |
| 9 | Chile | 65.3% |
| — | Latin America and Caribbean average | 61.7% |
Source: Olacde, renewability index map for July 2026. The report only details the countries above the average.
The list resembles the annual rankings: countries with large dams or plenty of wind dominate. For a global view, with full-year data and the comparison with Europe and Asia, see the ranking of countries with the most renewable energy.
Chile, ninth in renewables: why its figure rises in spring
Chile's 65.3% refers to July, the month with the least sunshine of the year and high heating demand. The figure changes a lot with the seasons. In September 2026, according to the monthly report of the National Electricity Coordinator (Coordinador Eléctrico Nacional) cited by Reporte Minero on October 30, hydro, solar and wind plants generated almost 84% of the electricity on Chile's National Electric System.
| Chile, September 2026 | Share of generation | September 2025 |
|---|---|---|
| Hydropower | 39.3% | 25.6% |
| Solar | 28.4% | — |
| Wind | 15.6% | — |
| Thermal | 16.4% | 33.3% |
Source: National Electricity Coordinator, monthly report for September 2026, via Reporte Minero (October 30, 2026).
That jump, driven by winter rains and stronger spring sunshine, sent wholesale prices tumbling. In October, the marginal cost of electricity hit its lowest level since 2002, with record curtailment of solar and wind energy that found no use.
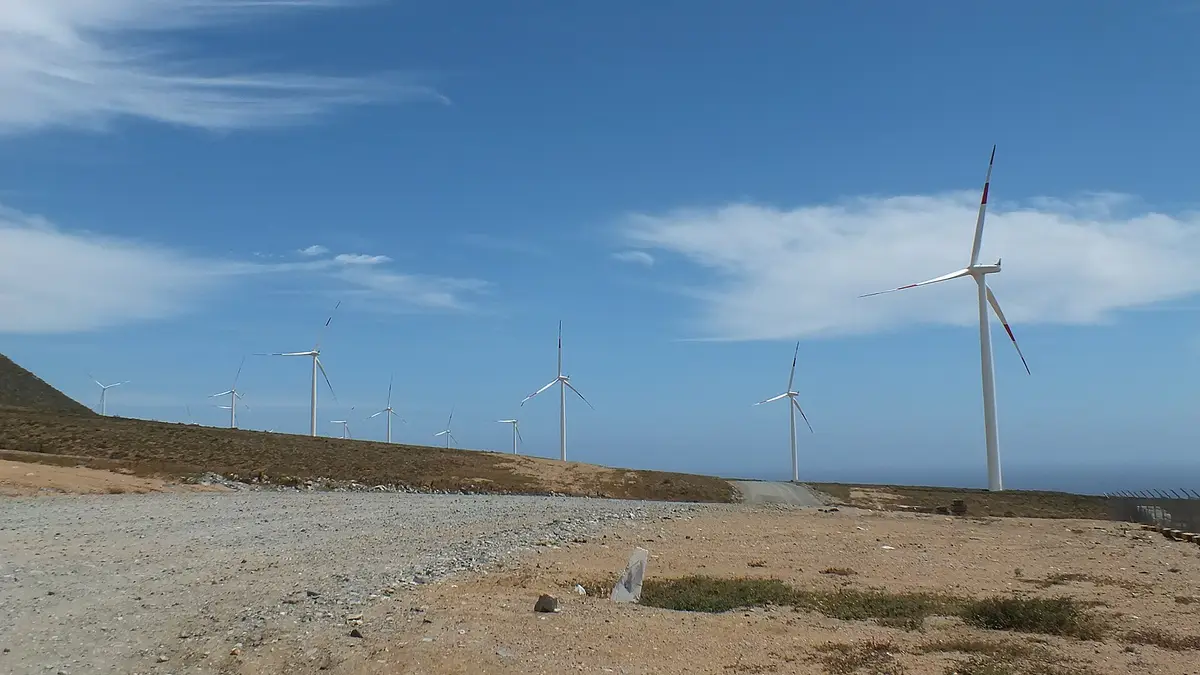
Regional renewability over the past 12 months
Between July 2025 and July 2026, the region's renewable share stayed above 60% the whole time. The peak was February 2026, at 69% (109 TWh renewable versus 49 TWh non-renewable), and the low was June 2026, at 61.5%, when renewable generation fell to 101 TWh and thermal rose to about 63 TWh. Total monthly generation ranged between 158 and 169 TWh.
The heavy reliance on hydropower, almost half of generation, makes the region sensitive to droughts: when it rains less, gas and oil cover the gap, as happened in June. That is why the big dams, starting with Itaipu and the largest hydroelectric power stations in the world, still set the pace of the Latin American power mix.
The mix also explains part of the tariff differences between countries, though not all of them: taxes, subsidies and grids weigh as much as the source. The details are in the ranking of electricity prices in Latin America.
Does your company generate, transmit or store energy in Latin America? Reach Energía Futura's readers.
See advertising optionsFrequently asked questions
How much electricity did Latin America generate in July 2026?
169 TWh, 3.7% more than in July 2025 (163 TWh), according to Olacde. It was the highest monthly figure in the past 12 months.
What share of the region's electricity is renewable?
61.7% in July 2026. Over the previous 12 months it ranged between 61.5% (June 2026) and 69% (February 2026).
Which Latin American country has the most renewable electricity?
Paraguay, with 100% in July 2026, followed by Uruguay (98.3%), Costa Rica (98%) and Brazil (90%).
Where does Chile rank?
Chile was ninth of the nine countries above the regional average, at 65.3% in July. In September, with more sun and water, its renewable generation reached almost 84%, according to the National Electricity Coordinator.
What is Olacde?
The Latin American and Caribbean Energy Organization, an intergovernmental body with 27 member countries that publishes regional energy statistics through its sieLAC system.