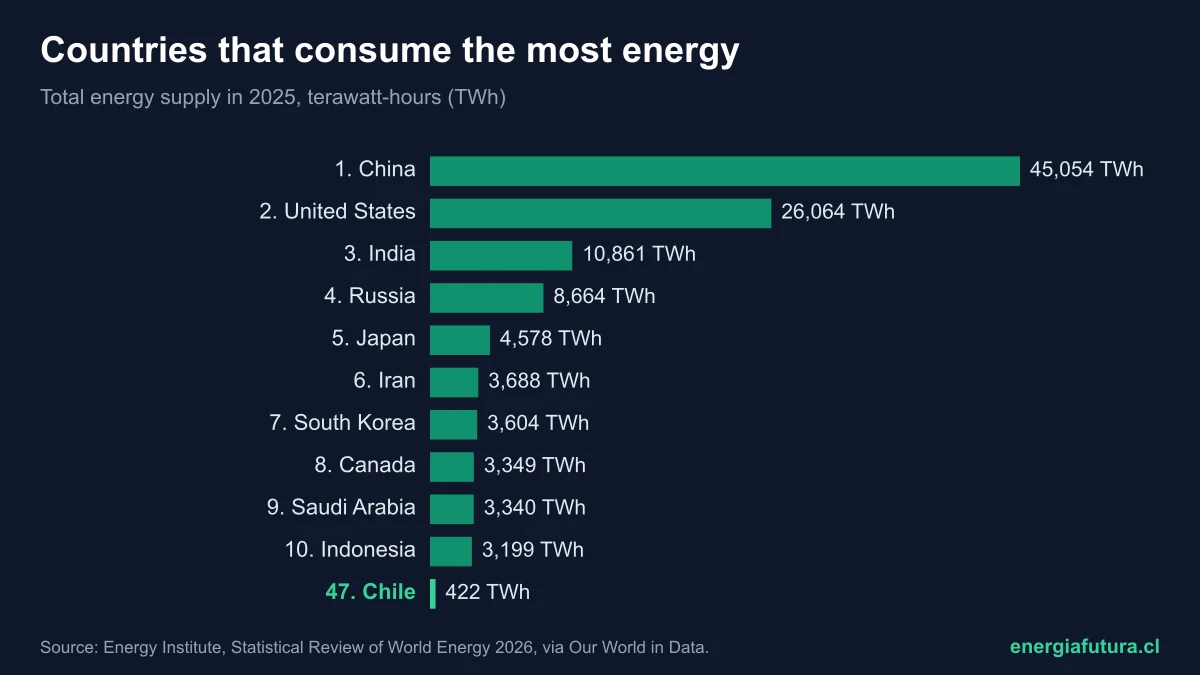
Updated on 20 November 2026. China is the country that consumes the most energy in the world: 45,054 terawatt-hours (TWh) in 2025, 27% of the world total and 1.7 times the United States, according to the 2026 edition of the Energy Institute's Statistical Review of World Energy. It is followed by the United States (26,064 TWh), India (10,861), Russia (8,664) and Japan (4,578). Chile ranks 47th of 79 countries, with 422 TWh.
The world consumed 166,754 TWh of energy in 2025, 1.4% more than in 2024 and 57% more than in 2000. The figure includes oil, gas, coal, nuclear, hydropower and renewables, and is published by Our World in Data as total energy supply using Energy Institute data.
View the data as a table
| World energy consumption | 166,754 TWh |
| China's share | 27.0% |
| Chile, rank 47 of 79 | 422 TWh |
Ranking of the countries that consume the most energy in 2025
| # | Country | 2025 consumption (TWh) | % of world | Change vs. 2024 | kWh per person |
|---|---|---|---|---|---|
| 1 | China | 45,054 | 27.0% | +2.1% | 31,815 |
| 2 | United States | 26,064 | 15.6% | +1.9% | 75,051 |
| 3 | India | 10,861 | 6.5% | +0.7% | 7,419 |
| 4 | Russia | 8,664 | 5.2% | −0.6% | 60,168 |
| 5 | Japan | 4,578 | 2.7% | −0.8% | 37,192 |
| 6 | Iran | 3,688 | 2.2% | +0.6% | 39,906 |
| 7 | South Korea | 3,604 | 2.2% | −1.5% | 69,745 |
| 8 | Canada | 3,349 | 2.0% | +1.5% | 83,452 |
| 9 | Saudi Arabia | 3,340 | 2.0% | +1.8% | 96,633 |
| 10 | Indonesia | 3,199 | 1.9% | +5.2% | 11,196 |
| 11 | Brazil | 3,109 | 1.9% | +2.0% | 14,609 |
| 12 | Germany | 2,790 | 1.7% | −0.2% | 33,183 |
| 13 | France | 2,507 | 1.5% | +0.3% | 37,613 |
| 14 | Mexico | 2,175 | 1.3% | −0.7% | 16,481 |
| 15 | Turkey | 2,033 | 1.2% | +4.5% | 23,190 |
| 47 | Chile | 422 | 0.25% | +1.0% | 21,237 |
Source: Energy Institute, Statistical Review of World Energy 2026, via Our World in Data. Total primary energy supply in 2025. The Energy Institute lists 79 countries separately; the rest are grouped in regional totals.
View the data as a table
| TWh | |
|---|---|
| China | 45,054 TWh · Rank 1 of 79 |
| United States | 26,064 TWh · Rank 2 of 79 |
| India | 10,861 TWh · Rank 3 of 79 |
| Russia | 8,664 TWh · Rank 4 of 79 |
| Japan | 4,578 TWh · Rank 5 of 79 |
| Iran | 3,688 TWh · Rank 6 of 79 |
| South Korea | 3,604 TWh · Rank 7 of 79 |
| Canada | 3,349 TWh · Rank 8 of 79 |
| Saudi Arabia | 3,340 TWh · Rank 9 of 79 |
| Indonesia | 3,199 TWh · Rank 10 of 79 |
| Brazil | 3,109 TWh · Rank 11 of 79 |
| Germany | 2,790 TWh · Rank 12 of 79 |
| France | 2,507 TWh · Rank 13 of 79 |
| Mexico | 2,175 TWh · Rank 14 of 79 |
| Türkiye | 2,033 TWh · Rank 15 of 79 |
| United Kingdom | 1,748 TWh · Rank 16 of 79 |
| Italy | 1,537 TWh · Rank 17 of 79 |
| Australia | 1,536 TWh · Rank 18 of 79 |
| United Arab Emirates | 1,460 TWh · Rank 19 of 79 |
| Spain | 1,444 TWh · Rank 20 of 79 |
| South Africa | 1,398 TWh · Rank 21 of 79 |
| Thailand | 1,391 TWh · Rank 22 of 79 |
| Malaysia | 1,346 TWh · Rank 23 of 79 |
| Vietnam | 1,305 TWh · Rank 24 of 79 |
| Taiwan | 1,184 TWh · Rank 25 of 79 |
| Egypt | 1,102 TWh · Rank 26 of 79 |
| Poland | 1,090 TWh · Rank 27 of 79 |
| Singapore | 1,024 TWh · Rank 28 of 79 |
| Kazakhstan | 910 TWh · Rank 29 of 79 |
| Netherlands | 879 TWh · Rank 30 of 79 |
| Argentina | 876 TWh · Rank 31 of 79 |
| Pakistan | 868 TWh · Rank 32 of 79 |
| Algeria | 796 TWh · Rank 33 of 79 |
| Philippines | 715 TWh · Rank 34 of 79 |
| Iraq | 699 TWh · Rank 35 of 79 |
| Ukraine | 662 TWh · Rank 36 of 79 |
| Qatar | 621 TWh · Rank 37 of 79 |
| Belgium | 612 TWh · Rank 38 of 79 |
| Uzbekistan | 591 TWh · Rank 39 of 79 |
| Bangladesh | 563 TWh · Rank 40 of 79 |
| Venezuela | 563 TWh · Rank 41 of 79 |
| Kuwait | 527 TWh · Rank 42 of 79 |
| Colombia | 495 TWh · Rank 43 of 79 |
| Oman | 481 TWh · Rank 44 of 79 |
| Sweden | 460 TWh · Rank 45 of 79 |
| Turkmenistan | 428 TWh · Rank 46 of 79 |
| Chile | 422 TWh · Rank 47 of 79 |
| Czech Republic | 421 TWh · Rank 48 of 79 |
| Romania | 317 TWh · Rank 49 of 79 |
| Peru | 317 TWh · Rank 50 of 79 |
| Belarus | 314 TWh · Rank 51 of 79 |
| Norway | 313 TWh · Rank 52 of 79 |
| Austria | 305 TWh · Rank 53 of 79 |
| Finland | 297 TWh · Rank 54 of 79 |
| Israel | 287 TWh · Rank 55 of 79 |
| Greece | 285 TWh · Rank 56 of 79 |
| Morocco | 276 TWh · Rank 57 of 79 |
| Hong Kong | 274 TWh · Rank 58 of 79 |
| New Zealand | 261 TWh · Rank 59 of 79 |
| Hungary | 254 TWh · Rank 60 of 79 |
| Switzerland | 244 TWh · Rank 61 of 79 |
| Portugal | 218 TWh · Rank 62 of 79 |
| Azerbaijan | 198 TWh · Rank 63 of 79 |
| Ecuador | 198 TWh · Rank 64 of 79 |
| Bulgaria | 193 TWh · Rank 65 of 79 |
| Slovakia | 180 TWh · Rank 66 of 79 |
| Ireland | 158 TWh · Rank 67 of 79 |
| Trinidad and Tobago | 150 TWh · Rank 68 of 79 |
| Denmark | 143 TWh · Rank 69 of 79 |
| Sri Lanka | 100 TWh · Rank 70 of 79 |
| Croatia | 91 TWh · Rank 71 of 79 |
| Iceland | 82 TWh · Rank 72 of 79 |
| Slovenia | 69 TWh · Rank 73 of 79 |
| Lithuania | 63 TWh · Rank 74 of 79 |
| Estonia | 50 TWh · Rank 75 of 79 |
| Luxembourg | 34 TWh · Rank 76 of 79 |
| Latvia | 33 TWh · Rank 77 of 79 |
| Cyprus | 33 TWh · Rank 78 of 79 |
| The Republic of North Macedonia | 29 TWh · Rank 79 of 79 |
| 1 | China | 45,054 | 2.1% | 31,815 |
| 2 | United States | 26,064 | 1.9% | 75,051 |
| 3 | India | 10,861 | 0.7% | 7,419 |
| 4 | Russia | 8,664 | -0.6% | 60,168 |
| 5 | Japan | 4,578 | -0.8% | 37,192 |
| 6 | Iran | 3,688 | 0.6% | 39,906 |
| 7 | South Korea | 3,604 | -1.5% | 69,745 |
| 8 | Canada | 3,349 | 1.5% | 83,452 |
| 9 | Saudi Arabia | 3,340 | 1.8% | 96,633 |
| 10 | Indonesia | 3,199 | 5.2% | 11,196 |
| 11 | Brazil | 3,109 | 2.0% | 14,609 |
| 12 | Germany | 2,790 | -0.2% | 33,183 |
| 13 | France | 2,507 | 0.3% | 37,613 |
| 14 | Mexico | 2,175 | -0.7% | 16,481 |
| 15 | Turkey | 2,033 | 4.5% | 23,190 |
| 16 | United Kingdom | 1,748 | -1.3% | 25,129 |
| 17 | Italy | 1,537 | -0.7% | 25,991 |
| 18 | Australia | 1,536 | -0.4% | 56,927 |
| 19 | United Arab Emirates | 1,460 | 3.5% | 128,665 |
| 20 | Spain | 1,444 | 2.2% | 30,144 |
| 21 | South Africa | 1,398 | -0.3% | 21,592 |
| 22 | Thailand | 1,391 | -3.2% | 19,425 |
| 23 | Malaysia | 1,346 | 1.6% | 37,410 |
| 24 | Vietnam | 1,305 | 3.7% | 12,847 |
| 25 | Taiwan | 1,184 | -1.4% | 51,231 |
| 26 | Egypt | 1,102 | 2.3% | 9,309 |
| 27 | Poland | 1,090 | 2.9% | 28,575 |
| 28 | Singapore | 1,024 | 0.2% | 174,382 |
| 29 | Kazakhstan | 910 | 6.1% | 43,679 |
| 30 | Netherlands | 879 | 0.4% | 47,910 |
| 31 | Argentina | 876 | -1.2% | 19,108 |
| 32 | Pakistan | 868 | 2.1% | 3,400 |
| 33 | Algeria | 796 | 1.9% | 16,785 |
| 34 | Philippines | 715 | -2.0% | 6,122 |
| 35 | Iraq | 699 | 4.0% | 14,867 |
| 36 | Ukraine | 662 | 4.8% | 16,981 |
| 37 | Qatar | 621 | -1.8% | 199,256 |
| 38 | Belgium | 612 | -2.5% | 52,020 |
| 39 | Uzbekistan | 591 | 2.9% | 15,949 |
| 40 | Bangladesh | 563 | 10.4% | 3,205 |
| 41 | Venezuela | 563 | -1.5% | 19,737 |
| 42 | Kuwait | 527 | 1.0% | 104,857 |
| 43 | Colombia | 495 | -4.1% | 9,268 |
| 44 | Oman | 481 | 6.2% | 87,463 |
| 45 | Sweden | 460 | -1.9% | 43,127 |
| 46 | Turkmenistan | 428 | 11.3% | 56,145 |
| 47 | Chile | 422 | 1.0% | 21,237 |
| 48 | Czechia | 421 | 2.8% | 39,669 |
| 49 | Romania | 317 | -1.7% | 16,755 |
| 50 | Peru | 317 | 1.1% | 9,155 |
| 51 | Belarus | 314 | -1.4% | 34,950 |
| 52 | Norway | 313 | 2.5% | 55,629 |
| 53 | Austria | 305 | -1.7% | 33,438 |
| 54 | Finland | 297 | -0.4% | 52,775 |
| 55 | Israel | 287 | -2.0% | 30,135 |
| 56 | Greece | 285 | 0.5% | 28,698 |
| 57 | Morocco | 276 | 4.9% | 7,172 |
| 58 | Hong Kong | 274 | 0.7% | 37,097 |
| 59 | New Zealand | 261 | 1.2% | 49,719 |
| 60 | Hungary | 254 | 0.6% | 26,331 |
| 61 | Switzerland | 244 | -8.7% | 27,197 |
| 62 | Portugal | 218 | 1.7% | 20,942 |
| 63 | Azerbaijan | 198 | -2.1% | 19,044 |
| 64 | Ecuador | 198 | 1.8% | 10,810 |
| 65 | Bulgaria | 193 | 2.0% | 28,804 |
| 66 | Slovakia | 180 | 1.0% | 32,859 |
| 67 | Ireland | 158 | -1.0% | 29,806 |
| 68 | Trinidad and Tobago | 150 | -6.9% | 99,506 |
| 69 | Denmark | 143 | -6.2% | 23,888 |
| 70 | Sri Lanka | 100 | 4.8% | 4,324 |
| 71 | Croatia | 91 | 5.0% | 23,532 |
| 72 | Iceland | 82 | -4.9% | 206,917 |
| 73 | Slovenia | 69 | -2.9% | 32,538 |
| 74 | Lithuania | 63 | -4.4% | 22,196 |
| 75 | Estonia | 50 | -5.6% | 37,195 |
| 76 | Luxembourg | 34 | -5.0% | 50,096 |
| 77 | Latvia | 33 | -0.5% | 17,612 |
| 78 | Cyprus | 33 | 3.1% | 23,714 |
| 79 | North Macedonia | 29 | 7.0% | 15,778 |
How China became the world's largest energy consumer
In 2000 China consumed 11,367 TWh, less than half the United States (26,255 TWh). Its industrialisation, city-building and economic growth quadrupled its consumption in 25 years. It overtook the United States in 2009, and the gap has kept widening ever since. The United States, by contrast, consumes almost the same as 25 years ago: 26,064 TWh in 2025.
India is the century's other big shift: it tripled its consumption, from 3,574 TWh in 2000 to 10,861 TWh in 2025. It passed Japan in 2010 and Russia in 2016, and is now the world's third-largest consumer. Japan and Germany, on the other hand, consume 26% and 29% less than in 2000, because of efficiency, changes in their industry and, in Japan's case, a shrinking population.
View the data as a table
| 2000 | 2001 | 2002 | 2003 | 2004 | 2005 | 2006 | 2007 | 2008 | 2009 | 2010 | 2011 | 2012 | 2013 | 2014 | 2015 | 2016 | 2017 | 2018 | 2019 | 2020 | 2021 | 2022 | 2023 | 2024 | 2025 | |
|---|---|---|---|---|---|---|---|---|---|---|---|---|---|---|---|---|---|---|---|---|---|---|---|---|---|---|
| United States | 26,255 TWh | 25,759 TWh | 26,074 TWh | 26,147 TWh | 26,703 TWh | 26,718 TWh | 26,473 TWh | 26,929 TWh | 26,239 TWh | 24,885 TWh | 25,743 TWh | 25,378 TWh | 24,742 TWh | 25,405 TWh | 25,669 TWh | 25,425 TWh | 25,311 TWh | 25,290 TWh | 26,216 TWh | 25,984 TWh | 23,940 TWh | 25,211 TWh | 25,617 TWh | 25,323 TWh | 25,568 TWh | 26,064 TWh |
| China | 11,367 TWh | 11,935 TWh | 13,032 TWh | 15,289 TWh | 17,855 TWh | 20,299 TWh | 22,253 TWh | 24,171 TWh | 24,865 TWh | 26,028 TWh | 27,707 TWh | 29,999 TWh | 30,950 TWh | 32,043 TWh | 32,616 TWh | 32,891 TWh | 32,872 TWh | 34,050 TWh | 35,589 TWh | 36,677 TWh | 37,624 TWh | 39,655 TWh | 40,304 TWh | 42,801 TWh | 44,107 TWh | 45,054 TWh |
| Russia | 6,919 TWh | 7,021 TWh | 7,021 TWh | 7,192 TWh | 7,225 TWh | 7,227 TWh | 7,567 TWh | 7,609 TWh | 7,674 TWh | 7,271 TWh | 7,585 TWh | 7,864 TWh | 7,918 TWh | 7,795 TWh | 7,843 TWh | 7,736 TWh | 7,869 TWh | 7,927 TWh | 8,221 TWh | 8,158 TWh | 7,839 TWh | 8,095 TWh | 8,420 TWh | 8,541 TWh | 8,717 TWh | 8,664 TWh |
| Japan | 6,186 TWh | 6,130 TWh | 6,124 TWh | 6,082 TWh | 6,180 TWh | 6,317 TWh | 6,302 TWh | 6,244 TWh | 6,118 TWh | 5,620 TWh | 5,973 TWh | 5,630 TWh | 5,531 TWh | 5,461 TWh | 5,288 TWh | 5,210 TWh | 5,139 TWh | 5,171 TWh | 5,140 TWh | 5,031 TWh | 4,639 TWh | 4,848 TWh | 4,794 TWh | 4,666 TWh | 4,613 TWh | 4,578 TWh |
| Germany | 3,953 TWh | 4,033 TWh | 3,972 TWh | 3,978 TWh | 3,964 TWh | 3,916 TWh | 4,011 TWh | 3,817 TWh | 3,862 TWh | 3,621 TWh | 3,770 TWh | 3,596 TWh | 3,625 TWh | 3,724 TWh | 3,557 TWh | 3,587 TWh | 3,648 TWh | 3,711 TWh | 3,599 TWh | 3,479 TWh | 3,207 TWh | 3,343 TWh | 3,143 TWh | 2,816 TWh | 2,795 TWh | 2,790 TWh |
| India | 3,574 TWh | 3,601 TWh | 3,739 TWh | 3,876 TWh | 4,159 TWh | 4,420 TWh | 4,634 TWh | 5,028 TWh | 5,346 TWh | 5,773 TWh | 6,026 TWh | 6,322 TWh | 6,695 TWh | 6,889 TWh | 7,361 TWh | 7,613 TWh | 7,969 TWh | 8,237 TWh | 8,688 TWh | 8,854 TWh | 8,349 TWh | 9,081 TWh | 9,530 TWh | 10,292 TWh | 10,783 TWh | 10,861 TWh |
| France | 3,067 TWh | 3,087 TWh | 3,102 TWh | 3,149 TWh | 3,185 TWh | 3,183 TWh | 3,155 TWh | 3,102 TWh | 3,105 TWh | 2,935 TWh | 3,028 TWh | 2,962 TWh | 2,928 TWh | 2,942 TWh | 2,837 TWh | 2,875 TWh | 2,801 TWh | 2,807 TWh | 2,822 TWh | 2,760 TWh | 2,436 TWh | 2,613 TWh | 2,296 TWh | 2,382 TWh | 2,501 TWh | 2,507 TWh |
| Canada | 2,961 TWh | 2,944 TWh | 3,038 TWh | 3,088 TWh | 3,152 TWh | 3,144 TWh | 3,146 TWh | 3,269 TWh | 3,212 TWh | 3,078 TWh | 3,152 TWh | 3,255 TWh | 3,252 TWh | 3,345 TWh | 3,372 TWh | 3,366 TWh | 3,326 TWh | 3,372 TWh | 3,439 TWh | 3,428 TWh | 3,188 TWh | 3,227 TWh | 3,300 TWh | 3,284 TWh | 3,300 TWh | 3,349 TWh |
| United Kingdom | 2,668 TWh | 2,700 TWh | 2,639 TWh | 2,681 TWh | 2,698 TWh | 2,720 TWh | 2,683 TWh | 2,604 TWh | 2,553 TWh | 2,413 TWh | 2,465 TWh | 2,312 TWh | 2,356 TWh | 2,357 TWh | 2,207 TWh | 2,218 TWh | 2,186 TWh | 2,168 TWh | 2,150 TWh | 2,080 TWh | 1,848 TWh | 1,874 TWh | 1,865 TWh | 1,781 TWh | 1,771 TWh | 1,748 TWh |
| South Korea | 2,274 TWh | 2,335 TWh | 2,442 TWh | 2,521 TWh | 2,592 TWh | 2,677 TWh | 2,731 TWh | 2,805 TWh | 2,861 TWh | 2,877 TWh | 3,101 TWh | 3,256 TWh | 3,291 TWh | 3,286 TWh | 3,324 TWh | 3,380 TWh | 3,495 TWh | 3,527 TWh | 3,599 TWh | 3,554 TWh | 3,417 TWh | 3,598 TWh | 3,646 TWh | 3,581 TWh | 3,660 TWh | 3,604 TWh |
| Italy | 2,015 TWh | 2,009 TWh | 2,028 TWh | 2,107 TWh | 2,153 TWh | 2,161 TWh | 2,158 TWh | 2,126 TWh | 2,080 TWh | 1,908 TWh | 1,982 TWh | 1,930 TWh | 1,850 TWh | 1,741 TWh | 1,677 TWh | 1,720 TWh | 1,717 TWh | 1,736 TWh | 1,728 TWh | 1,711 TWh | 1,537 TWh | 1,658 TWh | 1,645 TWh | 1,543 TWh | 1,548 TWh | 1,537 TWh |
| Brazil | 1,768 TWh | 1,786 TWh | 1,804 TWh | 1,807 TWh | 1,901 TWh | 1,941 TWh | 1,999 TWh | 2,127 TWh | 2,267 TWh | 2,223 TWh | 2,469 TWh | 2,559 TWh | 2,677 TWh | 2,815 TWh | 2,915 TWh | 2,888 TWh | 2,755 TWh | 2,789 TWh | 2,760 TWh | 2,813 TWh | 2,654 TWh | 2,849 TWh | 2,865 TWh | 2,938 TWh | 3,048 TWh | 3,109 TWh |
| Iran | 1,389 TWh | 1,484 TWh | 1,611 TWh | 1,638 TWh | 1,809 TWh | 1,913 TWh | 2,086 TWh | 2,221 TWh | 2,310 TWh | 2,367 TWh | 2,440 TWh | 2,535 TWh | 2,552 TWh | 2,650 TWh | 2,764 TWh | 2,742 TWh | 2,897 TWh | 2,998 TWh | 3,108 TWh | 3,243 TWh | 3,384 TWh | 3,352 TWh | 3,484 TWh | 3,578 TWh | 3,667 TWh | 3,688 TWh |
| Saudi Arabia | 1,335 TWh | 1,422 TWh | 1,481 TWh | 1,569 TWh | 1,702 TWh | 1,811 TWh | 1,900 TWh | 1,944 TWh | 2,128 TWh | 2,205 TWh | 2,451 TWh | 2,557 TWh | 2,714 TWh | 2,731 TWh | 2,932 TWh | 3,057 TWh | 3,180 TWh | 3,182 TWh | 3,101 TWh | 2,968 TWh | 2,887 TWh | 2,981 TWh | 3,128 TWh | 3,174 TWh | 3,280 TWh | 3,340 TWh |
| Indonesia | 1,179 TWh | 1,267 TWh | 1,307 TWh | 1,420 TWh | 1,407 TWh | 1,445 TWh | 1,472 TWh | 1,577 TWh | 1,604 TWh | 1,655 TWh | 1,777 TWh | 1,885 TWh | 1,984 TWh | 1,865 TWh | 1,905 TWh | 1,948 TWh | 1,932 TWh | 2,088 TWh | 2,198 TWh | 2,322 TWh | 2,190 TWh | 2,272 TWh | 2,826 TWh | 2,865 TWh | 3,041 TWh | 3,199 TWh |
View the data as a table
| China | United States | India | Russia | |
|---|---|---|---|---|
| 2000 | 11,367 | 26,255 | 3,574 | 6,919 |
| 2001 | 11,935 | 25,759 | 3,601 | 7,021 |
| 2002 | 13,032 | 26,074 | 3,739 | 7,021 |
| 2003 | 15,289 | 26,147 | 3,876 | 7,192 |
| 2004 | 17,855 | 26,703 | 4,159 | 7,225 |
| 2005 | 20,299 | 26,718 | 4,420 | 7,227 |
| 2006 | 22,253 | 26,473 | 4,634 | 7,567 |
| 2007 | 24,171 | 26,929 | 5,028 | 7,609 |
| 2008 | 24,865 | 26,239 | 5,346 | 7,674 |
| 2009 | 26,028 | 24,885 | 5,773 | 7,271 |
| 2010 | 27,707 | 25,743 | 6,026 | 7,585 |
| 2011 | 29,999 | 25,378 | 6,322 | 7,864 |
| 2012 | 30,950 | 24,742 | 6,695 | 7,918 |
| 2013 | 32,043 | 25,405 | 6,889 | 7,795 |
| 2014 | 32,616 | 25,669 | 7,361 | 7,843 |
| 2015 | 32,891 | 25,425 | 7,613 | 7,736 |
| 2016 | 32,872 | 25,311 | 7,969 | 7,869 |
| 2017 | 34,050 | 25,290 | 8,237 | 7,927 |
| 2018 | 35,589 | 26,216 | 8,688 | 8,221 |
| 2019 | 36,677 | 25,984 | 8,854 | 8,158 |
| 2020 | 37,624 | 23,940 | 8,349 | 7,839 |
| 2021 | 39,655 | 25,211 | 9,081 | 8,095 |
| 2022 | 40,304 | 25,617 | 9,530 | 8,420 |
| 2023 | 42,801 | 25,323 | 10,292 | 8,541 |
| 2024 | 44,107 | 25,568 | 10,783 | 8,717 |
| 2025 | 45,054 | 26,064 | 10,861 | 8,664 |

The countries that consume the most energy per person
Per person, the ranking changes completely. At the top are Iceland (206,917 kWh per person), with its aluminium industry powered by geothermal and hydropower; Qatar (199,256), Singapore (174,382), the United Arab Emirates (128,665) and Kuwait (104,857), countries with small populations and large oil, gas or refining industries. An Icelander uses 10 times more energy than the world average of 20,258 kWh per person.
The United States (75,051 kWh per person) and Canada (83,452) are the large countries with the highest consumption per person. China, despite being the largest consumer overall, stands at 31,815 kWh per person, and India at 7,419, almost a third of the world average. That gap explains why energy use in developing countries is expected to keep growing in the coming decades.
Energy consumption in Chile and Latin America
Chile consumed 422 TWh of energy in 2025, 1% more than in 2024, and ranks 47th of the 79 countries. Per person it uses 21,237 kWh, slightly above the world average and the second-highest figure in South America, behind Trinidad and Tobago (99,506 kWh, because of its gas industry). Its consumption has grown 56% since 2000, when it stood at 270 TWh.
In Latin America, Brazil consumes the most energy (3,109 TWh, 11th in the world), followed by Mexico (2,175 TWh, 14th), Argentina (876 TWh, 31st), Venezuela (563, 41st) and Colombia (495, 43rd), which had the biggest drop among the larger countries in the ranking, −4.1%. Chile's consumption relies mostly on imported fossil fuels: only 15.5% of the energy the country uses is renewable electricity, as we reported in the story on electrification in Chile.
| Country | World rank | 2025 consumption (TWh) | Change vs. 2024 | kWh per person |
|---|---|---|---|---|
| Brazil | 11 | 3,109 | +2.0% | 14,609 |
| Mexico | 14 | 2,175 | −0.7% | 16,481 |
| Argentina | 31 | 876 | −1.2% | 19,108 |
| Venezuela | 41 | 563 | −1.5% | 19,737 |
| Colombia | 43 | 495 | −4.1% | 9,268 |
| Chile | 47 | 422 | +1.0% | 21,237 |
| Peru | 50 | 317 | +1.1% | 9,155 |
| Ecuador | 64 | 198 | +1.8% | 10,810 |
| Trinidad and Tobago | 68 | 150 | −6.9% | 99,506 |
Source: Energy Institute, Statistical Review of World Energy 2026, via Our World in Data.

Where energy consumption rose and fell most in 2025
Among the 53 countries that consume more than 300 TWh a year, the biggest increase in 2025 was Turkmenistan's (+11.3%, to 428 TWh), followed by Bangladesh (+10.4%), Oman (+6.2%), Kazakhstan (+6.1%) and Indonesia (+5.2%), which at 3,199 TWh is now the world's tenth-largest consumer. The largest falls were in Colombia (−4.1%), Thailand (−3.2%), Belgium (−2.5%), the Philippines (−2%) and Sweden (−1.9%).
| Country | 2024 consumption (TWh) | 2025 consumption (TWh) | Change |
|---|---|---|---|
| Turkmenistan | 384 | 428 | +11.3% |
| Bangladesh | 510 | 563 | +10.4% |
| Oman | 452 | 481 | +6.2% |
| Kazakhstan | 858 | 910 | +6.1% |
| Indonesia | 3,041 | 3,199 | +5.2% |
| Colombia | 516 | 495 | −4.1% |
| Thailand | 1,437 | 1,391 | −3.2% |
| Belgium | 627 | 612 | −2.5% |
| Philippines | 730 | 715 | −2.0% |
| Sweden | 469 | 460 | −1.9% |
Source: Energy Institute, Statistical Review of World Energy 2026, via Our World in Data; countries consuming more than 300 TWh in 2025. Among the largest consumers, China rose 2.1% and the United States 1.9%, while South Korea (−1.5%), Japan (−0.8%) and Russia (−0.6%) fell.
Energy consumption by world region
Asia Pacific consumes almost half of the planet's energy: 78,845 TWh in 2025, 47.3% of the total, driven by China, India, Japan, South Korea and Indonesia. It is followed by North America (31,587 TWh, 18.9%) and Europe (20,037 TWh, 12%). South and Central America consume 7,268 TWh, 4.4% of the world, and Africa, with more than 1.4 billion people, just 3.6%.
Does your company work in energy, efficiency or the energy transition? Reach Energía Futura's readers.
See advertising optionsWhat the ranking means for the energy transition
The fact that world consumption keeps rising, 1.4% in 2025, explains why CO₂ emissions are not falling even though renewables are growing fast: much of the new energy meets extra demand rather than replacing fossil fuels. The Global Carbon Budget estimated that fossil emissions would fall by just 0.4% in 2026, as we reported in the story on the Global Carbon Budget 2026.
Electricity is a growing share of that consumption. To compare electricity alone, see the ranking of electricity consumption per capita by country.
Methodology
The data are the 2025 total primary energy supply published by Our World in Data from the Energy Institute's Statistical Review of World Energy 2026 (supplemented with the US EIA), in terawatt-hours. It includes all sources: oil, gas, coal, nuclear, hydropower, solar, wind, biomass and others. The 2026 edition uses a new energy-accounting approach, so its figures are not comparable with earlier editions; all the series in this article come from the 2026 edition. Regional aggregates are excluded. Consumption per person is calculated by Our World in Data using United Nations population figures.
How to cite this data
Energía Futura (2026). "Countries that consume the most energy 2026: world ranking of primary energy consumption and Chile". Updated on 20 November 2026. energiafutura.cl/en/news/countries-that-consume-the-most-energy-2026-world-ranking-of-primary-energy-consumption-and-chile. Data: Energy Institute (2026), Statistical Review of World Energy.
Frequently asked questions
Which country consumes the most energy in the world?
China, with 45,054 TWh in 2025, 27% of world consumption, according to the Energy Institute.
What are the top 5 energy-consuming countries?
China, the United States, India, Russia and Japan, in that order, in 2025.
Which country uses the most energy per person?
Iceland, with 206,917 kWh per person in 2025, followed by Qatar and Singapore.
How much energy does Chile consume?
422 TWh in 2025, 47th of 79 countries, and 21,237 kWh per person, slightly above the world average.
How much energy does the world consume?
166,754 TWh in 2025, 1.4% more than in 2024 and 57% more than in 2000.
Since when has China consumed more energy than the United States?
Since 2009, according to the Energy Institute series in Our World in Data.