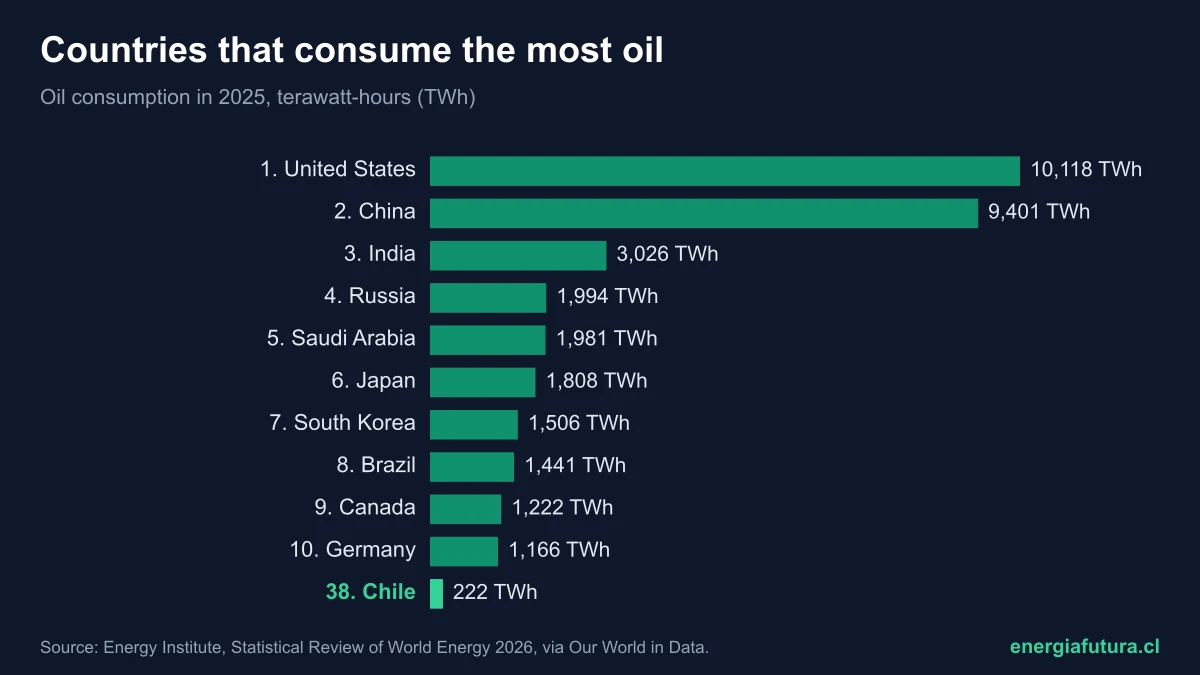
Updated on 20 November 2026. The United States is the country that consumes the most oil in the world: 10,118 terawatt-hours (TWh) in 2025, 18.1% of the world total, according to the 2026 edition of the Energy Institute's Statistical Review of World Energy. China follows closely with 9,401 TWh (16.8%) and already consumes 93% as much as the United States. The top five are completed by India (3,026 TWh), Russia (1,994) and Saudi Arabia (1,981). Chile ranks 38th of 79 countries, with 222 TWh.
World oil consumption reached 55,826 TWh in 2025, 1% more than in 2024 and 30% more than in 2000. It includes petrol, diesel, jet fuel, LPG and other products, and is published by Our World in Data using Energy Institute data. Oil remains the world's largest energy source: 33.5% of total supply.
View the data as a table
| World oil consumption | 55,826 TWh |
| The United States' share | 18.1% |
| Chile, rank 38 of 79 | 222 TWh |
Ranking of the countries that consume the most oil in 2025
| # | Country | 2025 consumption (TWh) | % of world | Change vs. 2024 | kWh per person |
|---|---|---|---|---|---|
| 1 | United States | 10,118 | 18.1% | +1.0% | 29,135 |
| 2 | China | 9,401 | 16.8% | +2.5% | 6,639 |
| 3 | India | 3,026 | 5.4% | 0.0% | 2,067 |
| 4 | Russia | 1,994 | 3.6% | −0.1% | 13,844 |
| 5 | Saudi Arabia | 1,981 | 3.5% | −2.5% | 57,316 |
| 6 | Japan | 1,808 | 3.2% | −1.6% | 14,688 |
| 7 | South Korea | 1,506 | 2.7% | −2.6% | 29,145 |
| 8 | Brazil | 1,441 | 2.6% | +1.0% | 6,771 |
| 9 | Canada | 1,222 | 2.2% | +0.9% | 30,453 |
| 10 | Germany | 1,166 | 2.1% | −0.9% | 13,873 |
| 11 | Iran | 1,075 | 1.9% | +0.6% | 11,629 |
| 12 | Mexico | 963 | 1.7% | −0.1% | 7,300 |
| 13 | Indonesia | 910 | 1.6% | +4.0% | 3,186 |
| 14 | Singapore | 882 | 1.6% | 0.0% | 150,304 |
| 15 | France | 769 | 1.4% | −1.1% | 11,532 |
| 38 | Chile | 222 | 0.40% | −0.8% | 11,159 |
Source: Energy Institute, Statistical Review of World Energy 2026, via Our World in Data. Consumption of refined oil products and other liquid fuels in 2025, measured in energy terms. The Energy Institute lists 79 countries separately.
View the data as a table
| TWh | |
|---|---|
| United States | 10,118 TWh · Rank 1 of 79 |
| China | 9,401 TWh · Rank 2 of 79 |
| India | 3,026 TWh · Rank 3 of 79 |
| Russia | 1,994 TWh · Rank 4 of 79 |
| Saudi Arabia | 1,981 TWh · Rank 5 of 79 |
| Japan | 1,808 TWh · Rank 6 of 79 |
| South Korea | 1,506 TWh · Rank 7 of 79 |
| Brazil | 1,441 TWh · Rank 8 of 79 |
| Canada | 1,222 TWh · Rank 9 of 79 |
| Germany | 1,166 TWh · Rank 10 of 79 |
| Iran | 1,075 TWh · Rank 11 of 79 |
| Mexico | 963 TWh · Rank 12 of 79 |
| Indonesia | 910 TWh · Rank 13 of 79 |
| Singapore | 882 TWh · Rank 14 of 79 |
| France | 769 TWh · Rank 15 of 79 |
| United Kingdom | 753 TWh · Rank 16 of 79 |
| Spain | 737 TWh · Rank 17 of 79 |
| Türkiye | 686 TWh · Rank 18 of 79 |
| Italy | 674 TWh · Rank 19 of 79 |
| Thailand | 644 TWh · Rank 20 of 79 |
| Australia | 622 TWh · Rank 21 of 79 |
| United Arab Emirates | 586 TWh · Rank 22 of 79 |
| Malaysia | 514 TWh · Rank 23 of 79 |
| Iraq | 512 TWh · Rank 24 of 79 |
| Taiwan | 465 TWh · Rank 25 of 79 |
| Netherlands | 460 TWh · Rank 26 of 79 |
| Egypt | 437 TWh · Rank 27 of 79 |
| Poland | 405 TWh · Rank 28 of 79 |
| Vietnam | 380 TWh · Rank 29 of 79 |
| Belgium | 327 TWh · Rank 30 of 79 |
| Argentina | 326 TWh · Rank 31 of 79 |
| Philippines | 279 TWh · Rank 32 of 79 |
| South Africa | 272 TWh · Rank 33 of 79 |
| Kuwait | 266 TWh · Rank 34 of 79 |
| Algeria | 255 TWh · Rank 35 of 79 |
| Colombia | 246 TWh · Rank 36 of 79 |
| Pakistan | 242 TWh · Rank 37 of 79 |
| Chile | 222 TWh · Rank 38 of 79 |
| Kazakhstan | 217 TWh · Rank 39 of 79 |
| Hong Kong | 189 TWh · Rank 40 of 79 |
| Qatar | 179 TWh · Rank 41 of 79 |
| Venezuela | 177 TWh · Rank 42 of 79 |
| Morocco | 176 TWh · Rank 43 of 79 |
| Greece | 176 TWh · Rank 44 of 79 |
| Bangladesh | 169 TWh · Rank 45 of 79 |
| Ecuador | 163 TWh · Rank 46 of 79 |
| Peru | 159 TWh · Rank 47 of 79 |
| Ukraine | 154 TWh · Rank 48 of 79 |
| Oman | 145 TWh · Rank 49 of 79 |
| Sweden | 144 TWh · Rank 50 of 79 |
| Romania | 134 TWh · Rank 51 of 79 |
| Austria | 129 TWh · Rank 52 of 79 |
| Portugal | 123 TWh · Rank 53 of 79 |
| Czech Republic | 118 TWh · Rank 54 of 79 |
| Israel | 115 TWh · Rank 55 of 79 |
| Switzerland | 107 TWh · Rank 56 of 79 |
| Norway | 104 TWh · Rank 57 of 79 |
| Hungary | 92 TWh · Rank 58 of 79 |
| Finland | 91 TWh · Rank 59 of 79 |
| Belarus | 90 TWh · Rank 60 of 79 |
| New Zealand | 90 TWh · Rank 61 of 79 |
| Ireland | 84 TWh · Rank 62 of 79 |
| Turkmenistan | 81 TWh · Rank 63 of 79 |
| Denmark | 77 TWh · Rank 64 of 79 |
| Uzbekistan | 73 TWh · Rank 65 of 79 |
| Sri Lanka | 73 TWh · Rank 66 of 79 |
| Azerbaijan | 71 TWh · Rank 67 of 79 |
| Bulgaria | 62 TWh · Rank 68 of 79 |
| Croatia | 49 TWh · Rank 69 of 79 |
| Slovakia | 47 TWh · Rank 70 of 79 |
| Lithuania | 34 TWh · Rank 71 of 79 |
| Cyprus | 30 TWh · Rank 72 of 79 |
| Slovenia | 29 TWh · Rank 73 of 79 |
| Luxembourg | 24 TWh · Rank 74 of 79 |
| Trinidad and Tobago | 19 TWh · Rank 75 of 79 |
| Latvia | 18 TWh · Rank 76 of 79 |
| Estonia | 15 TWh · Rank 77 of 79 |
| The Republic of North Macedonia | 14 TWh · Rank 78 of 79 |
| Iceland | 12 TWh · Rank 79 of 79 |
| 1 | United States | 10,118 | 1.0% | 29,135 |
| 2 | China | 9,401 | 2.5% | 6,639 |
| 3 | India | 3,026 | 0.0% | 2,067 |
| 4 | Russia | 1,994 | -0.1% | 13,844 |
| 5 | Saudi Arabia | 1,981 | -2.5% | 57,316 |
| 6 | Japan | 1,808 | -1.6% | 14,688 |
| 7 | South Korea | 1,506 | -2.6% | 29,145 |
| 8 | Brazil | 1,441 | 1.0% | 6,771 |
| 9 | Canada | 1,222 | 0.9% | 30,453 |
| 10 | Germany | 1,166 | -0.9% | 13,873 |
| 11 | Iran | 1,075 | 0.6% | 11,629 |
| 12 | Mexico | 963 | -0.1% | 7,300 |
| 13 | Indonesia | 910 | 4.0% | 3,186 |
| 14 | Singapore | 882 | -0.0% | 150,304 |
| 15 | France | 769 | -1.1% | 11,532 |
| 16 | United Kingdom | 753 | 0.2% | 10,829 |
| 17 | Spain | 737 | 0.2% | 15,393 |
| 18 | Turkey | 686 | 3.9% | 7,820 |
| 19 | Italy | 674 | -4.0% | 11,397 |
| 20 | Thailand | 644 | -0.2% | 8,995 |
| 21 | Australia | 622 | 0.2% | 23,053 |
| 22 | United Arab Emirates | 586 | 0.3% | 51,638 |
| 23 | Malaysia | 514 | 2.2% | 14,293 |
| 24 | Iraq | 512 | 5.6% | 10,885 |
| 25 | Taiwan | 465 | 2.3% | 20,104 |
| 26 | Netherlands | 460 | -1.4% | 25,083 |
| 27 | Egypt | 437 | 0.0% | 3,692 |
| 28 | Poland | 405 | 3.2% | 10,615 |
| 29 | Vietnam | 380 | 3.7% | 3,738 |
| 30 | Belgium | 327 | -0.2% | 27,825 |
| 31 | Argentina | 326 | -0.8% | 7,115 |
| 32 | Philippines | 279 | 2.2% | 2,386 |
| 33 | South Africa | 272 | 2.5% | 4,207 |
| 34 | Kuwait | 266 | -0.1% | 52,966 |
| 35 | Algeria | 255 | 1.6% | 5,375 |
| 36 | Colombia | 246 | -0.5% | 4,612 |
| 37 | Pakistan | 242 | 4.9% | 950 |
| 38 | Chile | 222 | -0.8% | 11,159 |
| 39 | Kazakhstan | 217 | 9.5% | 10,420 |
| 40 | Hong Kong | 189 | 4.7% | 25,618 |
| 41 | Qatar | 179 | 1.5% | 57,338 |
| 42 | Venezuela | 177 | -0.8% | 6,202 |
| 43 | Morocco | 176 | 4.8% | 4,592 |
| 44 | Greece | 176 | 0.5% | 17,713 |
| 45 | Bangladesh | 169 | 16.2% | 963 |
| 46 | Ecuador | 163 | -0.4% | 8,910 |
| 47 | Peru | 159 | 7.4% | 4,600 |
| 48 | Ukraine | 154 | -1.0% | 3,956 |
| 49 | Oman | 145 | 12.2% | 26,450 |
| 50 | Sweden | 144 | 0.5% | 13,544 |
| 51 | Romania | 134 | -3.1% | 7,066 |
| 52 | Austria | 129 | -2.2% | 14,164 |
| 53 | Portugal | 123 | 0.1% | 11,860 |
| 54 | Czechia | 118 | -0.6% | 11,129 |
| 55 | Israel | 115 | -1.5% | 12,044 |
| 56 | Switzerland | 107 | -0.2% | 11,915 |
| 57 | Norway | 104 | 1.9% | 18,522 |
| 58 | Hungary | 92 | -1.0% | 9,592 |
| 59 | Finland | 91 | -0.4% | 16,145 |
| 60 | Belarus | 90 | 0.1% | 10,017 |
| 61 | New Zealand | 90 | -0.2% | 17,111 |
| 62 | Ireland | 84 | -1.0% | 15,837 |
| 63 | Turkmenistan | 81 | 4.6% | 10,649 |
| 64 | Denmark | 77 | -7.5% | 12,766 |
| 65 | Uzbekistan | 73 | 0.2% | 1,977 |
| 66 | Sri Lanka | 73 | 6.3% | 3,132 |
| 67 | Azerbaijan | 71 | 0.3% | 6,832 |
| 68 | Bulgaria | 62 | 0.3% | 9,294 |
| 69 | Croatia | 49 | 4.1% | 12,619 |
| 70 | Slovakia | 47 | 4.7% | 8,497 |
| 71 | Lithuania | 34 | -10.2% | 11,941 |
| 72 | Cyprus | 30 | 2.7% | 22,076 |
| 73 | Slovenia | 29 | 5.6% | 13,695 |
| 74 | Luxembourg | 24 | -5.8% | 35,902 |
| 75 | Trinidad and Tobago | 19 | 1.6% | 12,824 |
| 76 | Latvia | 18 | -0.3% | 9,676 |
| 77 | Estonia | 15 | -7.5% | 10,913 |
| 78 | North Macedonia | 14 | 7.0% | 7,870 |
| 79 | Iceland | 12 | 0.7% | 29,334 |
China is closing in on the United States in oil consumption
In 2000 the United States consumed four times as much oil as China: 10,658 TWh against 2,627 TWh. In 25 years China multiplied its consumption by 3.6, to 9,401 TWh, driven by its petrochemical industry, freight transport and the growth of its car fleet. The United States, by contrast, now consumes 5% less than in 2000. Between 2024 and 2025 China grew 2.5% and the United States 1%.
China's pace, however, is slowing: the electrification of its transport, with millions of electric cars and buses a year, and the use of natural gas trucks are cutting demand for petrol and diesel. The International Energy Agency expects world demand growth to ease, as we reported in the story on world oil demand in 2026.
View the data as a table
| 2000 | 2001 | 2002 | 2003 | 2004 | 2005 | 2006 | 2007 | 2008 | 2009 | 2010 | 2011 | 2012 | 2013 | 2014 | 2015 | 2016 | 2017 | 2018 | 2019 | 2020 | 2021 | 2022 | 2023 | 2024 | 2025 | |
|---|---|---|---|---|---|---|---|---|---|---|---|---|---|---|---|---|---|---|---|---|---|---|---|---|---|---|
| United States | 10,658 TWh | 10,638 TWh | 10,646 TWh | 10,806 TWh | 11,201 TWh | 11,218 TWh | 11,074 TWh | 11,005 TWh | 10,278 TWh | 9,740 TWh | 9,895 TWh | 9,697 TWh | 9,473 TWh | 9,628 TWh | 9,693 TWh | 9,891 TWh | 9,965 TWh | 10,062 TWh | 10,303 TWh | 10,287 TWh | 9,035 TWh | 9,869 TWh | 9,930 TWh | 9,968 TWh | 10,018 TWh | 10,118 TWh |
| Japan | 3,195 TWh | 3,089 TWh | 3,046 TWh | 3,136 TWh | 3,061 TWh | 3,098 TWh | 3,003 TWh | 2,899 TWh | 2,785 TWh | 2,517 TWh | 2,552 TWh | 2,556 TWh | 2,713 TWh | 2,583 TWh | 2,452 TWh | 2,377 TWh | 2,306 TWh | 2,265 TWh | 2,197 TWh | 2,132 TWh | 1,917 TWh | 1,961 TWh | 1,960 TWh | 1,919 TWh | 1,837 TWh | 1,808 TWh |
| China | 2,627 TWh | 2,683 TWh | 2,896 TWh | 3,235 TWh | 3,778 TWh | 3,838 TWh | 4,117 TWh | 4,314 TWh | 4,408 TWh | 4,580 TWh | 5,214 TWh | 5,391 TWh | 5,654 TWh | 5,907 TWh | 6,143 TWh | 6,610 TWh | 6,824 TWh | 7,183 TWh | 7,529 TWh | 7,765 TWh | 7,869 TWh | 8,148 TWh | 8,267 TWh | 9,114 TWh | 9,173 TWh | 9,401 TWh |
| Germany | 1,570 TWh | 1,591 TWh | 1,538 TWh | 1,508 TWh | 1,490 TWh | 1,460 TWh | 1,457 TWh | 1,319 TWh | 1,399 TWh | 1,340 TWh | 1,358 TWh | 1,313 TWh | 1,305 TWh | 1,334 TWh | 1,298 TWh | 1,297 TWh | 1,322 TWh | 1,409 TWh | 1,337 TWh | 1,351 TWh | 1,223 TWh | 1,210 TWh | 1,242 TWh | 1,166 TWh | 1,177 TWh | 1,166 TWh |
| Russia | 1,466 TWh | 1,509 TWh | 1,456 TWh | 1,509 TWh | 1,488 TWh | 1,494 TWh | 1,570 TWh | 1,562 TWh | 1,612 TWh | 1,546 TWh | 1,605 TWh | 1,722 TWh | 1,781 TWh | 1,785 TWh | 1,876 TWh | 1,812 TWh | 1,839 TWh | 1,833 TWh | 1,851 TWh | 1,889 TWh | 1,816 TWh | 1,931 TWh | 1,982 TWh | 2,005 TWh | 1,996 TWh | 1,994 TWh |
| India | 1,278 TWh | 1,281 TWh | 1,324 TWh | 1,348 TWh | 1,427 TWh | 1,450 TWh | 1,532 TWh | 1,637 TWh | 1,719 TWh | 1,807 TWh | 1,848 TWh | 1,936 TWh | 2,052 TWh | 2,066 TWh | 2,125 TWh | 2,296 TWh | 2,514 TWh | 2,588 TWh | 2,705 TWh | 2,792 TWh | 2,538 TWh | 2,589 TWh | 2,805 TWh | 2,939 TWh | 3,026 TWh | 3,026 TWh |
| South Korea | 1,227 TWh | 1,227 TWh | 1,249 TWh | 1,260 TWh | 1,251 TWh | 1,257 TWh | 1,259 TWh | 1,292 TWh | 1,232 TWh | 1,247 TWh | 1,274 TWh | 1,287 TWh | 1,333 TWh | 1,335 TWh | 1,330 TWh | 1,394 TWh | 1,520 TWh | 1,505 TWh | 1,500 TWh | 1,487 TWh | 1,406 TWh | 1,499 TWh | 1,518 TWh | 1,490 TWh | 1,546 TWh | 1,506 TWh |
| France | 1,143 TWh | 1,142 TWh | 1,113 TWh | 1,117 TWh | 1,127 TWh | 1,104 TWh | 1,102 TWh | 1,076 TWh | 1,053 TWh | 1,011 TWh | 980 TWh | 964 TWh | 932 TWh | 920 TWh | 890 TWh | 902 TWh | 888 TWh | 902 TWh | 880 TWh | 872 TWh | 736 TWh | 791 TWh | 789 TWh | 778 TWh | 777 TWh | 769 TWh |
| Canada | 1,109 TWh | 1,140 TWh | 1,183 TWh | 1,227 TWh | 1,281 TWh | 1,249 TWh | 1,258 TWh | 1,293 TWh | 1,248 TWh | 1,218 TWh | 1,275 TWh | 1,274 TWh | 1,280 TWh | 1,281 TWh | 1,275 TWh | 1,279 TWh | 1,265 TWh | 1,248 TWh | 1,287 TWh | 1,282 TWh | 1,105 TWh | 1,136 TWh | 1,183 TWh | 1,195 TWh | 1,211 TWh | 1,222 TWh |
| Brazil | 1,099 TWh | 1,106 TWh | 1,079 TWh | 1,040 TWh | 1,076 TWh | 1,094 TWh | 1,121 TWh | 1,176 TWh | 1,229 TWh | 1,226 TWh | 1,310 TWh | 1,372 TWh | 1,448 TWh | 1,498 TWh | 1,541 TWh | 1,455 TWh | 1,380 TWh | 1,389 TWh | 1,318 TWh | 1,336 TWh | 1,247 TWh | 1,338 TWh | 1,390 TWh | 1,425 TWh | 1,427 TWh | 1,441 TWh |
| Mexico | 1,096 TWh | 1,073 TWh | 1,025 TWh | 1,033 TWh | 1,081 TWh | 1,078 TWh | 1,074 TWh | 1,139 TWh | 1,162 TWh | 1,111 TWh | 1,113 TWh | 1,124 TWh | 1,128 TWh | 1,104 TWh | 1,055 TWh | 1,078 TWh | 1,083 TWh | 1,053 TWh | 1,012 TWh | 928 TWh | 813 TWh | 908 TWh | 986 TWh | 967 TWh | 964 TWh | 963 TWh |
| Italy | 1,094 TWh | 1,075 TWh | 1,097 TWh | 1,088 TWh | 1,072 TWh | 1,034 TWh | 1,041 TWh | 1,011 TWh | 960 TWh | 875 TWh | 871 TWh | 838 TWh | 770 TWh | 704 TWh | 710 TWh | 716 TWh | 698 TWh | 698 TWh | 711 TWh | 701 TWh | 576 TWh | 645 TWh | 702 TWh | 688 TWh | 702 TWh | 674 TWh |
| Saudi Arabia | 862 TWh | 912 TWh | 943 TWh | 998 TWh | 1,078 TWh | 1,134 TWh | 1,202 TWh | 1,236 TWh | 1,364 TWh | 1,460 TWh | 1,618 TWh | 1,680 TWh | 1,770 TWh | 1,780 TWh | 1,957 TWh | 2,063 TWh | 2,126 TWh | 2,088 TWh | 1,979 TWh | 1,856 TWh | 1,754 TWh | 1,834 TWh | 1,957 TWh | 1,994 TWh | 2,031 TWh | 1,981 TWh |
| Iran | 776 TWh | 800 TWh | 807 TWh | 810 TWh | 849 TWh | 910 TWh | 992 TWh | 999 TWh | 1,030 TWh | 1,003 TWh | 972 TWh | 978 TWh | 999 TWh | 1,075 TWh | 992 TWh | 865 TWh | 888 TWh | 897 TWh | 933 TWh | 986 TWh | 951 TWh | 1,010 TWh | 1,033 TWh | 1,050 TWh | 1,069 TWh | 1,075 TWh |
View the data as a table
| China | United States | India | Japan | |
|---|---|---|---|---|
| 2000 | 2,627 | 10,658 | 1,278 | 3,195 |
| 2001 | 2,683 | 10,638 | 1,281 | 3,089 |
| 2002 | 2,896 | 10,646 | 1,324 | 3,046 |
| 2003 | 3,235 | 10,806 | 1,348 | 3,136 |
| 2004 | 3,778 | 11,201 | 1,427 | 3,061 |
| 2005 | 3,838 | 11,218 | 1,450 | 3,098 |
| 2006 | 4,117 | 11,074 | 1,532 | 3,003 |
| 2007 | 4,314 | 11,005 | 1,637 | 2,899 |
| 2008 | 4,408 | 10,278 | 1,719 | 2,785 |
| 2009 | 4,580 | 9,740 | 1,807 | 2,517 |
| 2010 | 5,214 | 9,895 | 1,848 | 2,552 |
| 2011 | 5,391 | 9,697 | 1,936 | 2,556 |
| 2012 | 5,654 | 9,473 | 2,052 | 2,713 |
| 2013 | 5,907 | 9,628 | 2,066 | 2,583 |
| 2014 | 6,143 | 9,693 | 2,125 | 2,452 |
| 2015 | 6,610 | 9,891 | 2,296 | 2,377 |
| 2016 | 6,824 | 9,965 | 2,514 | 2,306 |
| 2017 | 7,183 | 10,062 | 2,588 | 2,265 |
| 2018 | 7,529 | 10,303 | 2,705 | 2,197 |
| 2019 | 7,765 | 10,287 | 2,792 | 2,132 |
| 2020 | 7,869 | 9,035 | 2,538 | 1,917 |
| 2021 | 8,148 | 9,869 | 2,589 | 1,961 |
| 2022 | 8,267 | 9,930 | 2,805 | 1,960 |
| 2023 | 9,114 | 9,968 | 2,939 | 1,919 |
| 2024 | 9,173 | 10,018 | 3,026 | 1,837 |
| 2025 | 9,401 | 10,118 | 3,026 | 1,808 |

The countries that consume the most oil per person
Per person, first place goes to Singapore, with 150,304 kWh per person, because it is one of the world's largest refining and ship-bunkering hubs. It is followed by Qatar (57,338), Saudi Arabia (57,316), Kuwait (52,966) and the United Arab Emirates (51,638), major producers that use oil to generate electricity, desalinate water and in their industry. The world average is 6,782 kWh per person.
Chile consumes 11,159 kWh of oil per person, 1.6 times the world average and the second-highest figure in the region, behind Trinidad and Tobago. That is more than Brazil (6,771), Mexico (7,300) or Argentina (7,115), because of the weight of road transport, mining and diesel in backup power generation.
Oil consumption in Chile and Latin America
Chile consumed 222 TWh of oil in 2025, 0.8% less than in 2024, and ranks 38th of 79. Its consumption has grown 59% since 2000, when it was 139 TWh. Since Chile produces very little crude, almost all of it is imported, either as crude for Enap's refineries or as refined diesel and petrol. That is why international prices feed straight into the pump, as we explain in the guide to the oil price today.
In the region, Brazil is the largest consumer (1,441 TWh, 8th in the world), followed by Mexico (963 TWh, 12th), Argentina (326 TWh, 31st), Colombia (246, 36th) and Chile (222, 38th). Further down are Venezuela (177), Ecuador (163) and Peru (159).
| Country | World rank | 2025 consumption (TWh) | kWh per person | Oil as % of its energy |
|---|---|---|---|---|
| Brazil | 8 | 1,441 | 6,771 | 46.4% |
| Mexico | 12 | 963 | 7,300 | 44.3% |
| Argentina | 31 | 326 | 7,115 | 37.2% |
| Colombia | 36 | 246 | 4,612 | 49.8% |
| Chile | 38 | 222 | 11,159 | 52.5% |
| Venezuela | 42 | 177 | 6,202 | 31.4% |
| Ecuador | 46 | 163 | 8,910 | 82.4% |
| Peru | 47 | 159 | 4,600 | 50.3% |
Source: Energy Institute, Statistical Review of World Energy 2026, via Our World in Data. The percentage is each country's oil consumption divided by its total energy supply, both in TWh; Energía Futura calculation.
Where oil consumption rose and fell most in 2025
Among the 31 countries that consume more than 300 TWh of oil a year, the biggest increase in 2025 was Iraq's (+5.6%), followed by Indonesia (+4%), Turkey (+3.9%), Vietnam (+3.7%), Poland (+3.2%) and China (+2.5%). The largest falls were in Italy (−4%), South Korea (−2.6%), Saudi Arabia (−2.5%) and Japan (−1.6%), which has been cutting its consumption for two decades.
| Country | 2024 consumption (TWh) | 2025 consumption (TWh) | Change |
|---|---|---|---|
| Iraq | 485 | 512 | +5.6% |
| Indonesia | 876 | 910 | +4.0% |
| Turkey | 660 | 686 | +3.9% |
| Vietnam | 366 | 380 | +3.7% |
| Poland | 392 | 405 | +3.2% |
| China | 9,173 | 9,401 | +2.5% |
| Italy | 702 | 674 | −4.0% |
| South Korea | 1,546 | 1,506 | −2.6% |
| Saudi Arabia | 2,031 | 1,981 | −2.5% |
| Japan | 1,837 | 1,808 | −1.6% |
Source: Energy Institute, Statistical Review of World Energy 2026, via Our World in Data; countries with oil consumption above 300 TWh in 2025. Japan now consumes 43% less oil than in 2000 (1,808 against 3,195 TWh), one of the largest declines among major consumers.
Where oil weighs most in the energy mix
Worldwide, oil is 33.5% of energy. In Chile it is 52.5%, more than half, and the country ranks 18th of 79 among the most oil-dependent. In the region only Ecuador (82.4%) is higher, as it uses oil products in almost all its transport and industry. The most dependent countries in the world are islands or refining and shipping hubs, such as Cyprus (93.1%) and Singapore (86.2%).

Does your company work in fuels, transport or electric mobility? Reach Energía Futura's readers.
See advertising optionsOil consumption and production: who depends on whom
Comparing this ranking with that of the world's largest oil producers shows who depends on imports. The United States produces more than it consumes. China, India, Japan, South Korea and Germany consume far more than they produce and are the big importers. Saudi Arabia, Russia and Iraq export most of what they produce. Chile belongs to the group of almost fully import-dependent countries.
Methodology
The data are 2025 oil consumption published by Our World in Data from the Energy Institute's Statistical Review of World Energy 2026 (supplemented with the US EIA), in terawatt-hours. It includes refined oil products and other liquid fuels, such as petrol, diesel, jet fuel, fuel oil and LPG. Regional aggregates are excluded. Consumption per person is calculated by Our World in Data; oil's share of each country's energy is an Energía Futura calculation using total energy supply from the same source.
How to cite this data
Energía Futura (2026). "Countries that consume the most oil 2026: world ranking and Chile". Updated on 20 November 2026. energiafutura.cl/en/news/countries-that-consume-the-most-oil-2026-world-ranking-and-chile. Data: Energy Institute (2026), Statistical Review of World Energy.
Frequently asked questions
Which country consumes the most oil?
The United States, with 10,118 TWh in 2025, 18.1% of world consumption, according to the Energy Institute.
What are the top 5 oil-consuming countries?
The United States, China, India, Russia and Saudi Arabia, in that order, in 2025.
How much oil does Chile consume?
222 TWh in 2025, 38th of 79. It is 52.5% of the energy the country consumes and equals 11,159 kWh per person.
Which country consumes the most oil per person?
Singapore, because of its refining and ship-bunkering industry, followed by Qatar and Saudi Arabia.
Which Latin American country consumes the most oil?
Brazil, eighth in the world with 1,441 TWh in 2025, followed by Mexico.
Will China overtake the United States in oil consumption?
It is close: in 2025 it consumed 93% as much as the United States, but the electrification of its transport is slowing its growth.