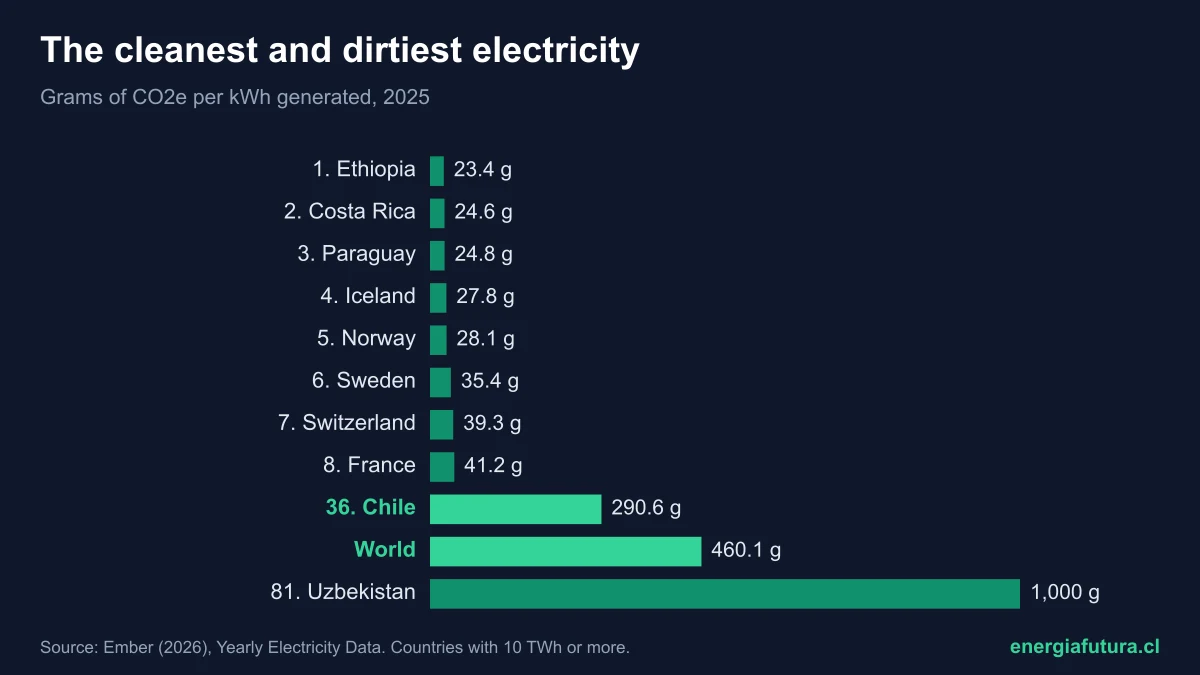
Updated November 13, 2026. Ethiopia has the world's cleanest electricity: each kWh it generated in 2025 emitted 23.4 grams of CO2 equivalent, according to annual data from Ember, the think tank that compiles every country's power generation. It is followed by Costa Rica (24.6 g) and Paraguay (24.8 g), all three with almost entirely hydro-based electricity. At the other end, Uzbekistan emitted 1,000 g/kWh. Chile ranks 36th of 81 countries, at 290.6 g/kWh.
The world average fell to 460 g/kWh in 2025, from 534 in 2015, thanks to the growth of solar and wind. Carbon intensity is the best way to compare how clean each country's electricity is, because it does not depend on the size of its economy. This data sheet brings together the ranking, a map, Chile's trend and Latin America, in the middle of COP31.
View the data as a table
| Ethiopia, the cleanest | 23.4 g/kWh |
| World average 2025 | 460.1 g/kWh |
| Chile | 290.6 g/kWh |
| Uzbekistan, the dirtiest | 1,000 g/kWh |
The countries with the cleanest electricity in the world
The ranking includes the 81 countries that generated at least 10 TWh in 2025 and already have data for that year in Ember. The top places go to countries with a lot of hydropower (Ethiopia, Paraguay, Norway, Iceland), geothermal (Iceland, Kenya, Costa Rica) or nuclear power (France, Sweden, Switzerland, Finland, Slovakia).
| # | Country | gCO2e per kWh (2025) | Generation (TWh) | Main source |
|---|---|---|---|---|
| 1 | Ethiopia | 23.4 | 33.4 | Hydro |
| 2 | Costa Rica | 24.6 | 12.9 | Hydro, geothermal and wind |
| 3 | Paraguay | 24.8 | 45.4 | Hydro (Itaipu and Yacyretá) |
| 4 | Iceland | 27.8 | 18.3 | Hydro and geothermal |
| 5 | Norway | 28.1 | 160.9 | Hydro |
| 6 | Sweden | 35.4 | 170.2 | Hydro and nuclear |
| 7 | Switzerland | 39.3 | 65.0 | Hydro and nuclear |
| 8 | France | 41.2 | 574.4 | Nuclear |
| 9 | Finland | 58.8 | 82.5 | Nuclear, wind and hydro |
| 10 | Tajikistan | 72.6 | 24.0 | Hydro |
| 11 | Kyrgyzstan | 79.9 | 12.8 | Hydro |
| 12 | Uruguay | 80.5 | 12.0 | Wind, hydro and biomass |
| 13 | Slovakia | 95.3 | 29.1 | Nuclear |
| 14 | Kenya | 95.9 | 14.0 | Geothermal and hydro |
| 15 | New Zealand | 96.5 | 44.0 | Hydro and geothermal |
| 16 | Brazil | 109.2 | 763.7 | Hydro, wind and solar |
Source: Ember, Yearly Electricity Data (downloaded November 13, 2026), life-cycle emissions intensity in grams of CO2 equivalent per kWh generated. The main source column is Energía Futura's description based on each country's mix.
The countries with the dirtiest electricity
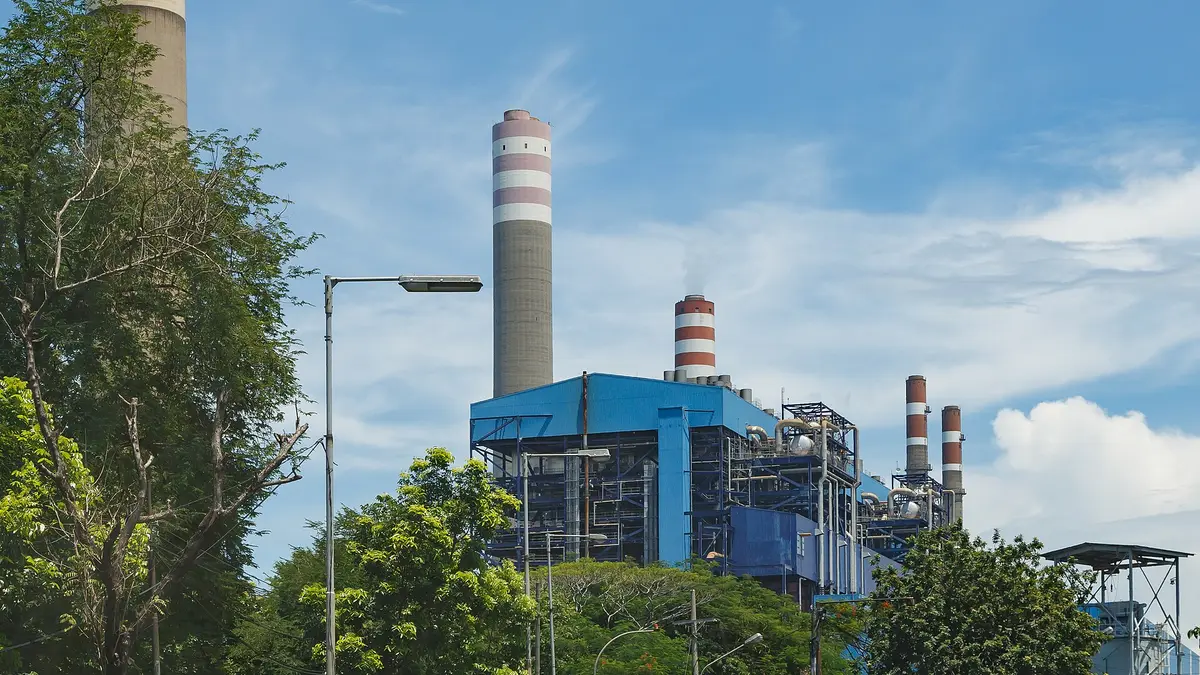
At the other end are countries that rely on coal or on oil and gas to generate power. Uzbekistan (1,000 g/kWh) and Kazakhstan (813 g/kWh) burn coal and gas in old plants; Indonesia (705 g/kWh) and South Africa (699 g/kWh) are two of the most coal-dependent economies in the world. India, the planet's third-largest generator, is at 671 g/kWh.
| # | Country | gCO2e per kWh (2025) | Generation (TWh) |
|---|---|---|---|
| 1 | Uzbekistan | 1,000.0 | 86.7 |
| 2 | Kazakhstan | 812.8 | 124.4 |
| 3 | Indonesia | 705.3 | 528.2 |
| 4 | South Africa | 699.0 | 242.8 |
| 5 | Bangladesh | 696.1 | 103.4 |
| 6 | Serbia | 695.7 | 36.2 |
| 7 | Saudi Arabia | 679.8 | 471.4 |
| 8 | India | 671.0 | 2,080.2 |
| 9 | Puerto Rico | 656.1 | 19.5 |
| 10 | Iran | 656.1 | 398.7 |
| 11 | Azerbaijan | 639.3 | 27.8 |
| 12 | Kuwait | 634.6 | 89.5 |
| 13 | Taiwan | 633.6 | 288.9 |
| 14 | Malaysia | 605.5 | 210.4 |
| 15 | Morocco | 603.0 | 44.2 |
Source: Ember, Yearly Electricity Data, countries with at least 10 TWh of generation in 2025. How much each country generates from coal is in our ranking of the countries generating the most coal power.
View the data as a table
| Uzbekistan | 1,000 g/kWh |
| Kazakhstan | 813 g/kWh |
| Indonesia | 705 g/kWh |
| South Africa | 699 g/kWh |
| Serbia | 696 g/kWh |
| Bangladesh | 696 g/kWh |
| Saudi Arabia | 680 g/kWh |
| India | 671 g/kWh |
| Iran | 656 g/kWh |
| Puerto Rico | 656 g/kWh |
| Azerbaijan | 639 g/kWh |
| Kuwait | 635 g/kWh |
| Taiwan | 634 g/kWh |
| Malaysia | 606 g/kWh |
| Morocco | 603 g/kWh |
| Philippines | 595 g/kWh |
| Poland | 591 g/kWh |
| Bosnia and Herzegovina | 573 g/kWh |
| Tunisia | 562 g/kWh |
| Egypt | 557 g/kWh |
| Oman | 541 g/kWh |
| Dominican Republic | 538 g/kWh |
| People's Republic of China | 528 g/kWh |
| Thailand | 526 g/kWh |
| Australia | 518 g/kWh |
| Cambodia | 499 g/kWh |
| Singapore | 497 g/kWh |
| Israel | 493 g/kWh |
| Bolivia | 481 g/kWh |
| Mexico | 481 g/kWh |
| Türkiye | 476 g/kWh |
| Japan | 474 g/kWh |
| United Arab Emirates | 470 g/kWh |
| Vietnam | 459 g/kWh |
| Nigeria | 452 g/kWh |
| Russia | 447 g/kWh |
| South Korea | 418 g/kWh |
| Czech Republic | 401 g/kWh |
| United States | 384 g/kWh |
| Sri Lanka | 352 g/kWh |
| Argentina | 346 g/kWh |
| Germany | 334 g/kWh |
| Greece | 325 g/kWh |
| Belarus | 315 g/kWh |
| Pakistan | 308 g/kWh |
| Chile | 291 g/kWh |
| Italy | 285 g/kWh |
| Bulgaria | 275 g/kWh |
| Ireland | 271 g/kWh |
| Romania | 258 g/kWh |
| Netherlands | 254 g/kWh |
| Peru | 238 g/kWh |
| United Kingdom | 218 g/kWh |
| Canada | 192 g/kWh |
| Colombia | 186 g/kWh |
| Slovenia | 183 g/kWh |
| Hungary | 162 g/kWh |
| Croatia | 159 g/kWh |
| Ecuador | 158 g/kWh |
| Spain | 154 g/kWh |
| Belgium | 151 g/kWh |
| Georgia | 147 g/kWh |
| Portugal | 128 g/kWh |
| Denmark | 120 g/kWh |
| Austria | 117 g/kWh |
| Brazil | 109 g/kWh |
| New Zealand | 97 g/kWh |
| Kenya | 96 g/kWh |
| Slovakia | 95 g/kWh |
| Uruguay | 81 g/kWh |
| Kyrgyzstan | 80 g/kWh |
| Tajikistan | 73 g/kWh |
| Finland | 59 g/kWh |
| France | 41 g/kWh |
| Switzerland | 39 g/kWh |
| Sweden | 35 g/kWh |
| Iceland | 28 g/kWh |
| Norway | 28 g/kWh |
| Costa Rica | 25 g/kWh |
| Paraguay | 25 g/kWh |
| Ethiopia | 23 g/kWh |
Chile's place in the clean electricity ranking
Chile generated 88.5 TWh in 2025 at an intensity of 290.6 g/kWh, 37% below the world average. That is huge progress: in 2013 the country was at 554 g/kWh, above the world average. The decline is explained by the growth of solar power, which already supplies 25.1% of electricity, and of wind, with 13.1%, and by the retirement of coal plants.
But 2025 was a step back: intensity rose from 260.9 to 290.6 g/kWh. The reason is water. Hydropower fell from 26.0 to 19.7 TWh because of drought and coal replaced it, rising from 13.6 to 15.7 TWh. It is the same reason the country's CO2 emissions rose in 2025, as we reported in our story on the Global Carbon Budget 2026.
| Source | 2023 (TWh) | 2024 (TWh) | 2025 (TWh) | Share in 2025 |
|---|---|---|---|---|
| Solar | 17.9 | 20.2 | 22.2 | 25.1% |
| Hydro | 23.3 | 26.0 | 19.7 | 22.2% |
| Coal | 14.5 | 13.6 | 15.7 | 17.8% |
| Gas | 16.8 | 12.7 | 13.5 | 15.3% |
| Wind | 9.5 | 10.4 | 11.6 | 13.1% |
| Bioenergy | 5.2 | 5.0 | 5.0 | 5.7% |
| Other fossil | 1.6 | 0.3 | 0.5 | 0.6% |
| Total | 89.2 | 88.6 | 88.5 | 100% |
| Intensity (g/kWh) | 304.8 | 260.9 | 290.6 | — |
Source: Ember, Yearly Electricity Data, Chile.
View the data as a table
| Chile | World | |
|---|---|---|
| 2010 | 482 g | 544 g |
| 2011 | 494 g | 551 g |
| 2012 | 533 g | 549 g |
| 2013 | 554 g | 549 g |
| 2014 | 496 g | 545 g |
| 2015 | 493 g | 534 g |
| 2016 | 498 g | 526 g |
| 2017 | 489 g | 523 g |
| 2018 | 472 g | 519 g |
| 2019 | 458 g | 507 g |
| 2020 | 438 g | 494 g |
| 2021 | 432 g | 497 g |
| 2022 | 374 g | 492 g |
| 2023 | 305 g | 486 g |
| 2024 | 261 g | 473 g |
| 2025 | 291 g | 460 g |
View the data as a table
| Solar | Wind | Hydro | Bioenergy | Gas | Coal | Other fossil | |
|---|---|---|---|---|---|---|---|
| 2023 | 17.9 TWh | 9.5 TWh | 23.3 TWh | 5.2 TWh | 16.8 TWh | 14.5 TWh | 1.6 TWh |
| 2024 | 20.2 TWh | 10.4 TWh | 26.0 TWh | 5.0 TWh | 12.7 TWh | 13.6 TWh | 0.3 TWh |
| 2025 | 22.2 TWh | 11.6 TWh | 19.7 TWh | 5.0 TWh | 13.5 TWh | 15.7 TWh | 0.5 TWh |
The cleanest electricity in Latin America
Latin America has the cleanest electricity of any world region, thanks to its large hydropower plants. Costa Rica and Paraguay are on the world podium, and Uruguay and Brazil among the top 16. Chile sits mid-table in the region, behind Ecuador, Colombia and Peru, and ahead of Argentina, Bolivia and Mexico.
Electricity in the major economies
Among the largest economies, France (41 g/kWh, thanks to nuclear), Brazil (109 g/kWh, thanks to water), Canada (192) and the United Kingdom (218) have cleaner electricity than Chile. Germany (334) is close; the United States (384) and Japan (474) are higher, and China (528) and India (671) are above the world average.
| Country | gCO2e per kWh (2025) | Rank (of 81) |
|---|---|---|
| France | 41.2 | 8 |
| Brazil | 109.2 | 16 |
| Canada | 192.0 | 28 |
| United Kingdom | 218.0 | 29 |
| Chile | 290.6 | 36 |
| Germany | 334.0 | 40 |
| United States | 384.0 | 43 |
| South Korea | 418.0 | 45 |
| Russia | 447.0 | 46 |
| Japan | 474.0 | 50 |
| Mexico | 481.4 | 53 |
| Australia | 518.0 | 57 |
| China | 528.0 | 59 |
| India | 671.0 | 74 |
Source: Ember, Yearly Electricity Data. Values rounded to the unit except France, Brazil, Chile and Mexico.
What share of each country's electricity is renewable is in our ranking of countries with the most renewable energy. Carbon intensity adds something more: it also counts nuclear power as clean, which explains the strong showing of France, Sweden and Slovakia.
Full carbon intensity ranking of electricity
The table lets you search for a country and sort by intensity, generation or power sector emissions. Some large countries do not yet have 2025 data in Ember, such as Venezuela, Ukraine, Algeria, Iraq and Qatar.
| 1 | Ethiopia | 23.4 | 33.4 | 0.8 |
| 2 | Costa Rica | 24.6 | 12.9 | 0.3 |
| 3 | Paraguay | 24.8 | 45.4 | 1.1 |
| 4 | Iceland | 27.8 | 18.3 | 0.5 |
| 5 | Norway | 28.1 | 160.9 | 4.5 |
| 6 | Sweden | 35.4 | 170.2 | 6.0 |
| 7 | Switzerland | 39.3 | 65.0 | 2.6 |
| 8 | France | 41.2 | 574.4 | 23.7 |
| 9 | Finland | 58.8 | 82.5 | 4.8 |
| 10 | Tajikistan | 72.6 | 24.0 | 1.7 |
| 11 | Kyrgyzstan | 79.9 | 12.8 | 1.0 |
| 12 | Uruguay | 80.5 | 12.0 | 1.0 |
| 13 | Slovakia | 95.3 | 29.1 | 2.8 |
| 14 | Kenya | 95.9 | 14.0 | 1.3 |
| 15 | New Zealand | 96.5 | 44.0 | 4.2 |
| 16 | Brazil | 109.2 | 763.7 | 83.4 |
| 17 | Austria | 116.6 | 73.2 | 8.5 |
| 18 | Denmark | 119.6 | 35.6 | 4.3 |
| 19 | Portugal | 127.8 | 51.1 | 6.5 |
| 20 | Georgia | 146.9 | 13.5 | 2.0 |
| 21 | Belgium | 151.3 | 72.1 | 10.9 |
| 22 | Spain | 154.1 | 288.3 | 44.4 |
| 23 | Ecuador | 158.5 | 36.6 | 5.8 |
| 24 | Croatia | 158.5 | 14.7 | 2.3 |
| 25 | Hungary | 162.0 | 40.1 | 6.5 |
| 26 | Slovenia | 182.9 | 14.9 | 2.7 |
| 27 | Colombia | 186.0 | 90.4 | 16.8 |
| 28 | Canada | 191.6 | 660.2 | 126.5 |
| 29 | United Kingdom | 218.0 | 293.7 | 64.0 |
| 30 | Peru | 238.0 | 60.5 | 14.4 |
| 31 | Netherlands | 253.7 | 135.0 | 34.3 |
| 32 | Romania | 258.4 | 49.8 | 12.9 |
| 33 | Ireland | 270.7 | 31.6 | 8.6 |
| 34 | Bulgaria | 275.3 | 38.1 | 10.5 |
| 35 | Italy | 284.9 | 265.2 | 75.6 |
| 36 | Chile | 290.6 | 88.5 | 25.7 |
| 37 | Pakistan | 308.1 | 171.1 | 52.7 |
| 38 | Belarus | 315.2 | 45.4 | 14.3 |
| 39 | Greece | 324.6 | 57.9 | 18.8 |
| 40 | Germany | 334.1 | 497.0 | 166.1 |
| 41 | Argentina | 345.6 | 153.3 | 53.0 |
| 42 | Sri Lanka | 352.2 | 18.6 | 6.5 |
| 43 | United States | 384.4 | 4,519.8 | 1,737.4 |
| 44 | Czechia | 400.8 | 75.5 | 30.3 |
| 45 | South Korea | 417.7 | 627.8 | 262.2 |
| 46 | Russia | 446.9 | 1,194.4 | 533.8 |
| 47 | Nigeria | 451.7 | 42.5 | 19.2 |
| 48 | Vietnam | 458.9 | 329.0 | 151.0 |
| 49 | United Arab Emirates | 469.7 | 184.4 | 86.6 |
| 50 | Japan | 473.7 | 1,027.4 | 486.7 |
| 51 | Turkey | 475.8 | 353.9 | 168.4 |
| 52 | Bolivia | 481.3 | 13.6 | 6.6 |
| 53 | Mexico | 481.4 | 389.7 | 187.6 |
| 54 | Israel | 492.9 | 82.1 | 40.5 |
| 55 | Singapore | 497.0 | 60.1 | 29.9 |
| 56 | Cambodia | 498.8 | 17.8 | 8.9 |
| 57 | Australia | 518.0 | 285.9 | 148.1 |
| 58 | Thailand | 525.9 | 200.5 | 105.4 |
| 59 | People's Republic of China | 528.3 | 10,505.7 | 5,549.9 |
| 60 | Dominican Republic | 538.0 | 22.6 | 12.2 |
| 61 | Oman | 540.7 | 53.0 | 28.7 |
| 62 | Egypt | 557.2 | 242.4 | 135.1 |
| 63 | Tunisia | 561.5 | 22.4 | 12.6 |
| 64 | Bosnia and Herzegovina | 572.8 | 14.5 | 8.3 |
| 65 | Poland | 590.8 | 172.7 | 102.1 |
| 66 | Philippines | 595.4 | 123.2 | 73.3 |
| 67 | Morocco | 603.0 | 44.1 | 26.6 |
| 68 | Malaysia | 605.5 | 210.4 | 127.4 |
| 69 | Taiwan | 633.6 | 288.9 | 183.1 |
| 70 | Kuwait | 634.6 | 89.5 | 56.8 |
| 71 | Azerbaijan | 639.3 | 27.8 | 17.7 |
| 72 | Iran | 656.0 | 398.7 | 261.6 |
| 73 | Puerto Rico | 656.1 | 19.5 | 12.8 |
| 74 | India | 671.0 | 2,080.2 | 1,395.7 |
| 75 | Saudi Arabia | 679.8 | 471.4 | 320.5 |
| 76 | Serbia | 695.7 | 36.2 | 25.2 |
| 77 | Bangladesh | 696.1 | 103.4 | 72.0 |
| 78 | South Africa | 699.0 | 242.8 | 169.7 |
| 79 | Indonesia | 705.3 | 528.2 | 372.6 |
| 80 | Kazakhstan | 812.8 | 124.4 | 101.1 |
| 81 | Uzbekistan | 1,000.0 | 86.7 | 86.7 |
Methodology
The data come from Ember's annual dataset, published under a CC BY 4.0 license. Intensity corresponds to life-cycle emissions (including construction, fuel and operation) of all generation in each country, divided by the kWh generated. Only countries with at least 10 TWh of generation in 2025 are included, so that islands or very small countries do not distort the ranking. The 2025 data are the most recent and may be revised when countries publish official statistics.
How to cite this data
Energía Futura (2026). «Countries with the cleanest and dirtiest electricity 2026: carbon intensity ranking and Chile's place». Updated November 13, 2026. energiafutura.cl/en/news/countries-with-the-cleanest-and-dirtiest-electricity-2026-carbon-intensity-ranking-and-chile. Data: Ember (2026), Yearly Electricity Data.
Does your company work in clean energy or decarbonization? Reach Energía Futura's readers.
See advertising optionsFrequently asked questions
Which country has the cleanest electricity in the world?
Ethiopia, at 23.4 g of CO2e per kWh in 2025, followed by Costa Rica (24.6) and Paraguay (24.8), according to Ember.
Which country has the dirtiest electricity?
Uzbekistan, at 1,000 g/kWh, followed by Kazakhstan (813) and Indonesia (705), among countries with more than 10 TWh of generation.
How clean is Chile's electricity?
Chile emitted 290.6 g of CO2e per kWh in 2025, 36th of 81 and 37% below the world average, although it rose from 260.9 in 2024 because of drought.
What is the world average emissions per kWh?
460 g of CO2e per kWh in 2025, the lowest in the series; in 2015 it was 534.
What is the carbon intensity of electricity?
The grams of CO2 equivalent emitted for each kWh generated. The lower it is, the cleaner the electricity.